Technical Analysis of JHPI 2024-05-10
Overview:
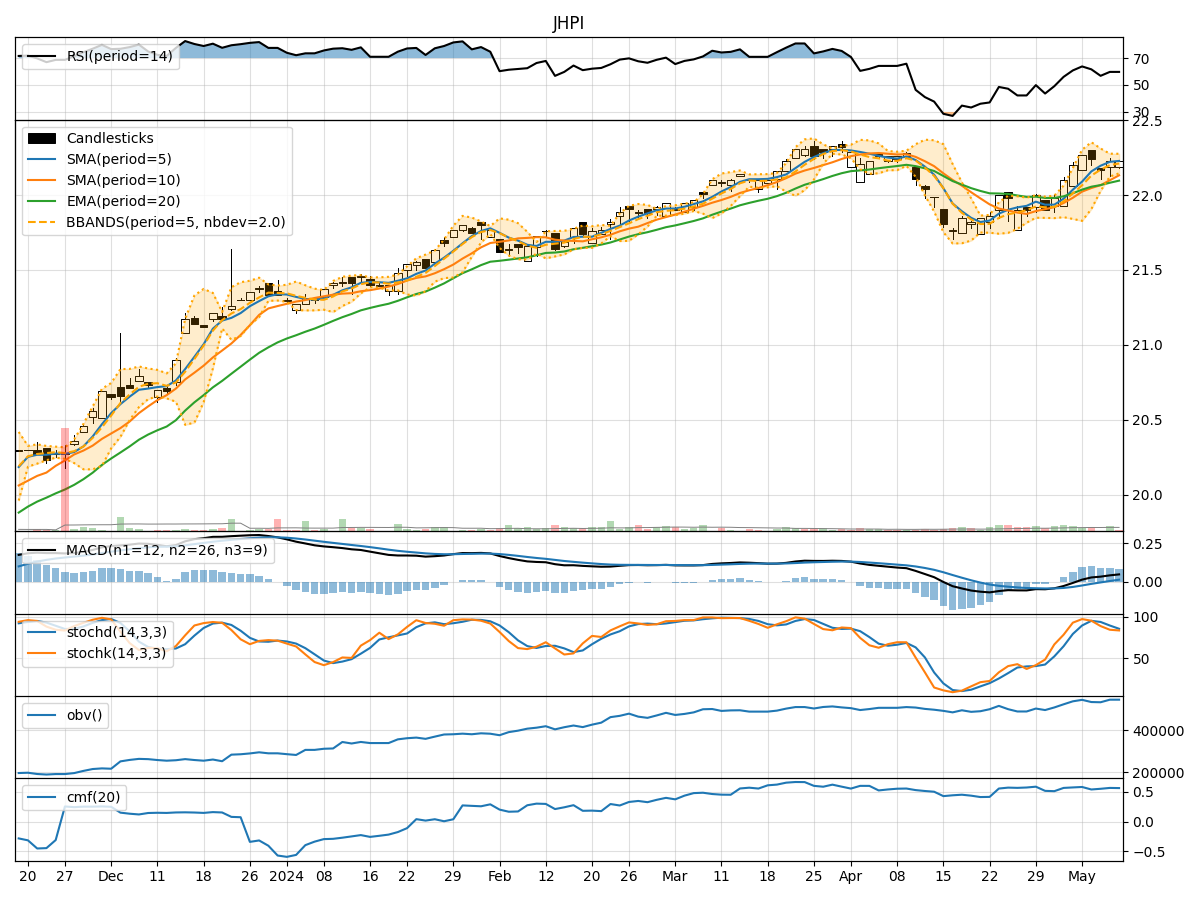
In the last 5 trading days, JHPI stock has shown relatively stable price movements with minor fluctuations. The trend indicators suggest a slight uptrend, supported by the moving averages and MACD values. Momentum indicators indicate a neutral to slightly bearish sentiment, while volatility indicators show decreasing volatility. Volume indicators reflect consistent buying pressure.
Trend Analysis:
- Moving Averages (MA): The 5-day MA is above the 10-day SMA, indicating a short-term bullish trend.
- MACD: The MACD line is above the signal line, suggesting a bullish momentum.
- EMA: The EMA values have been gradually increasing, supporting a potential uptrend.
Key Observation: The trend indicators point towards a bullish sentiment in the short term.
Momentum Analysis:
- RSI: The RSI values are in the neutral zone, indicating a balanced momentum.
- Stochastic Oscillator: Both %K and %D values are decreasing, signaling a potential bearish momentum.
- Williams %R: The Williams %R values are close to oversold levels, suggesting a possible reversal.
Key Observation: The momentum indicators suggest a neutral to slightly bearish outlook.
Volatility Analysis:
- Bollinger Bands (BB): The bands are narrowing, indicating decreasing volatility.
- Bollinger %B: The %B value is hovering around 0.5, reflecting a balanced volatility level.
Key Observation: Volatility is decreasing, which may lead to a period of consolidation or sideways movement.
Volume Analysis:
- On-Balance Volume (OBV): The OBV values have been relatively stable, indicating consistent buying pressure.
- Chaikin Money Flow (CMF): The CMF values are positive, suggesting a healthy inflow of money into the stock.
Key Observation: The volume indicators support the current price trend, indicating sustained buying interest.
Conclusion:
Based on the analysis of the technical indicators, the next few days for JHPI stock are likely to see a continuation of the bullish trend in the short term, supported by the trend indicators. However, the momentum indicators suggest a neutral to slightly bearish sentiment, which could lead to some minor pullbacks or consolidation. The decreasing volatility indicates a potential period of sideways movement before any significant price action. Overall, investors should monitor the momentum closely for any signs of a trend reversal while considering the strong buying pressure indicated by the volume indicators.