Technical Analysis of JIG 2024-05-10
Overview:
In analyzing the technical indicators for JIG stock over the last 5 days, we will delve into the trends, momentum, volatility, and volume aspects to provide a comprehensive outlook on the possible stock price movement in the coming days. By examining key indicators such as moving averages, MACD, RSI, Bollinger Bands, and OBV, we aim to offer valuable insights and predictions for informed decision-making.
Trend Analysis:
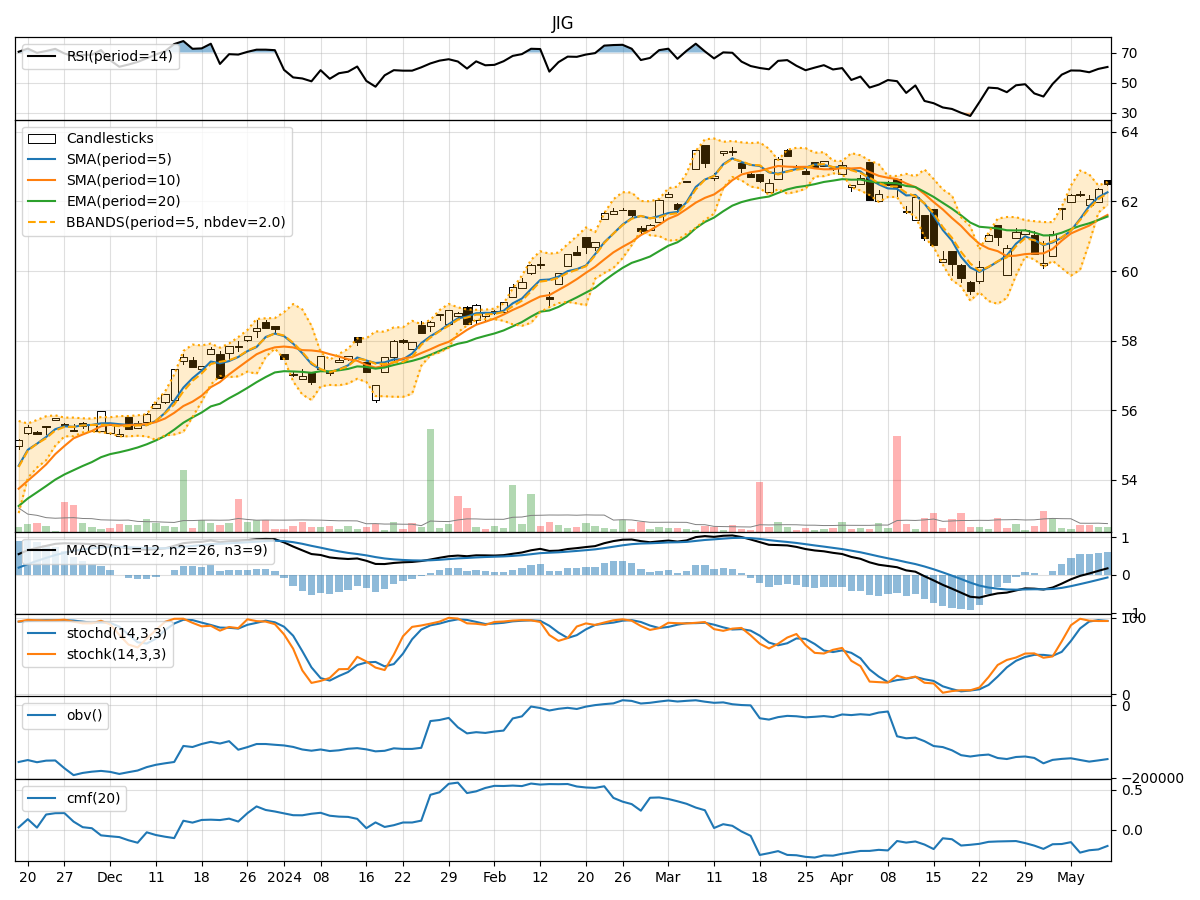
- Moving Averages (MA): The 5-day moving average has been consistently above the simple moving average (SMA) and exponential moving average (EMA), indicating a bullish trend.
- MACD: The MACD line has been consistently above the signal line, with both lines showing an upward trend, suggesting bullish momentum.
Momentum Analysis:
- RSI: The Relative Strength Index (RSI) has been fluctuating around the 60-70 range, indicating a neutral to slightly bullish momentum.
- Stochastic Oscillator: Both %K and %D have been in the overbought zone, suggesting a potential reversal or consolidation phase.
Volatility Analysis:
- Bollinger Bands: The stock price has been trading within the Bollinger Bands, with the bands narrowing, indicating decreasing volatility.
Volume Analysis:
- On-Balance Volume (OBV): The OBV has been showing a slight decline, suggesting a decrease in buying pressure.
- Chaikin Money Flow (CMF): The CMF has been negative, indicating a bearish money flow.
Key Observations:
- The trend indicators suggest a strong bullish sentiment, supported by the moving averages and MACD.
- Momentum indicators show a neutral to slightly bullish stance, with the RSI hovering in the mid-range.
- Volatility has been decreasing, as indicated by the narrowing Bollinger Bands.
- The volume indicators reflect a decrease in buying pressure and bearish money flow.
Conclusion:
Based on the analysis of the technical indicators, the next few days' possible stock price movement for JIG is likely to be sideways or consolidating. The bullish trend indicated by moving averages and MACD may face resistance due to overbought conditions in the stochastic oscillator and a lack of significant buying pressure as reflected in OBV and CMF. The decreasing volatility suggests a period of consolidation, with the stock price likely to trade within a range. Traders should exercise caution and wait for clearer signals before making significant trading decisions.