Technical Analysis of JIRE 2024-05-10
Overview:
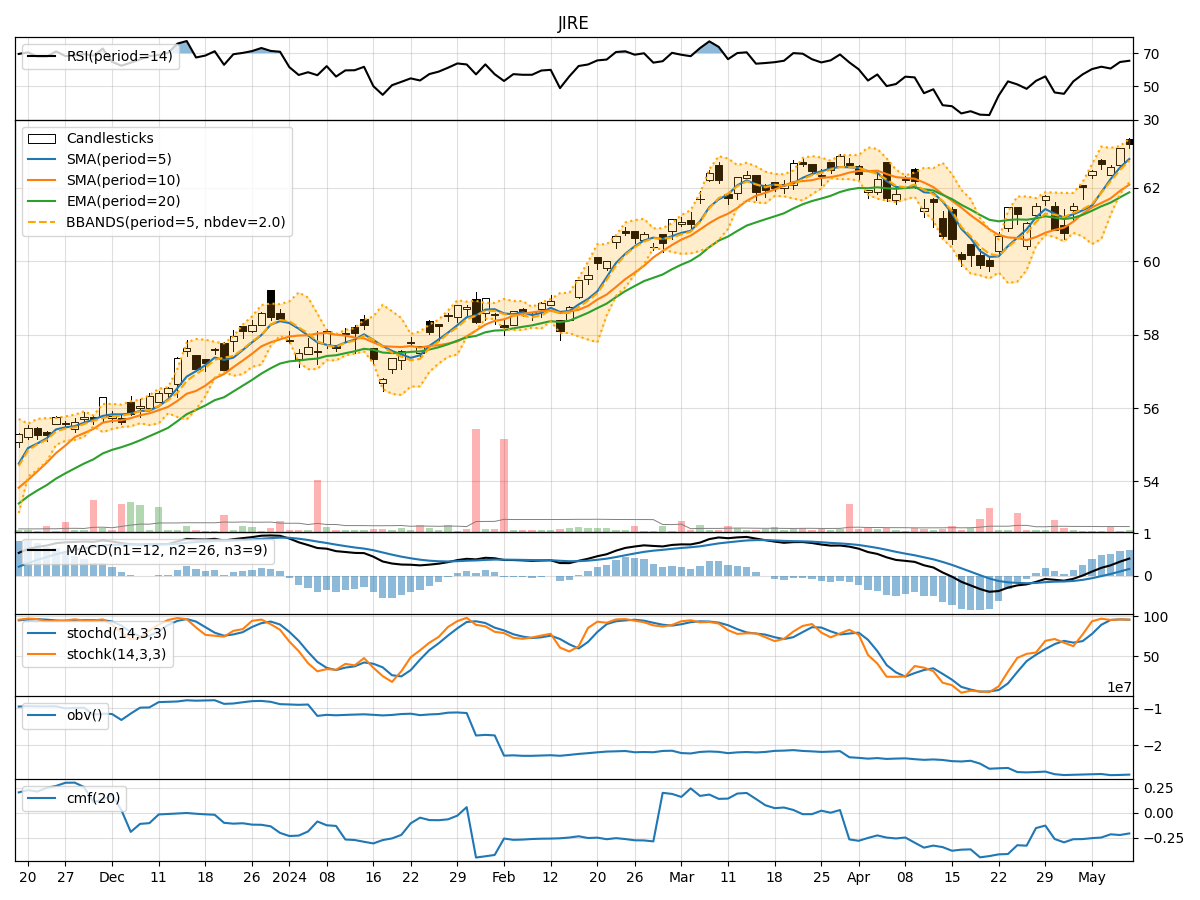
In analyzing the technical indicators for JIRE stock over the last 5 days, we will delve into the trends, momentum, volatility, and volume aspects to provide a comprehensive outlook on the possible stock price movement in the coming days.
Trend Analysis:
- Moving Averages (MA): The 5-day Moving Average (MA) has been consistently rising, indicating a bullish trend in the short term.
- MACD: The MACD line has been above the signal line for all 5 days, suggesting a bullish momentum.
- EMA: The Exponential Moving Average has also been trending upwards, supporting the bullish sentiment.
Momentum Analysis:
- RSI: The Relative Strength Index (RSI) has been in the overbought territory, indicating a strong bullish momentum.
- Stochastic Oscillator: Both %K and %D have been in the overbought zone, signaling a potential reversal or consolidation.
- Williams %R: The Williams %R is also in the oversold region, suggesting a possible pullback.
Volatility Analysis:
- Bollinger Bands: The stock price has been consistently trading above the upper Bollinger Band, indicating overbought conditions and a potential reversal.
- Bollinger Band Width: The Band Width has been narrowing, suggesting a decrease in volatility and a possible period of consolidation.
Volume Analysis:
- On-Balance Volume (OBV): The OBV has been declining, indicating selling pressure and potential bearish sentiment.
- Chaikin Money Flow (CMF): The CMF has been negative, reflecting a lack of buying interest and potential weakness in the stock.
Key Observations and Opinions:
- Trend: The overall trend is bullish based on moving averages and MACD, indicating a potential continuation of the upward movement.
- Momentum: The overbought conditions in RSI and Stochastic suggest a possible correction or consolidation in the near term.
- Volatility: The narrowing Bollinger Bands and declining OBV point towards a period of consolidation or a minor pullback.
- Volume: The negative CMF and declining OBV signal a lack of strong buying interest and potential weakness in the stock.
Conclusion:
Based on the analysis of technical indicators, the stock is likely to experience a short-term consolidation or minor pullback due to overbought momentum, declining volume indicators, and overbought conditions in the Williams %R and Stochastic Oscillator. Traders should exercise caution and consider potential profit-taking opportunities in the near future.