Technical Analysis of JMBS 2024-05-10
Overview:
In analyzing the technical indicators for JMBS stock over the last 5 days, we will delve into the trend, momentum, volatility, and volume indicators to provide a comprehensive outlook on the possible stock price movement in the coming days. By examining these key indicators, we aim to offer valuable insights and predictions for informed decision-making.
Trend Analysis:
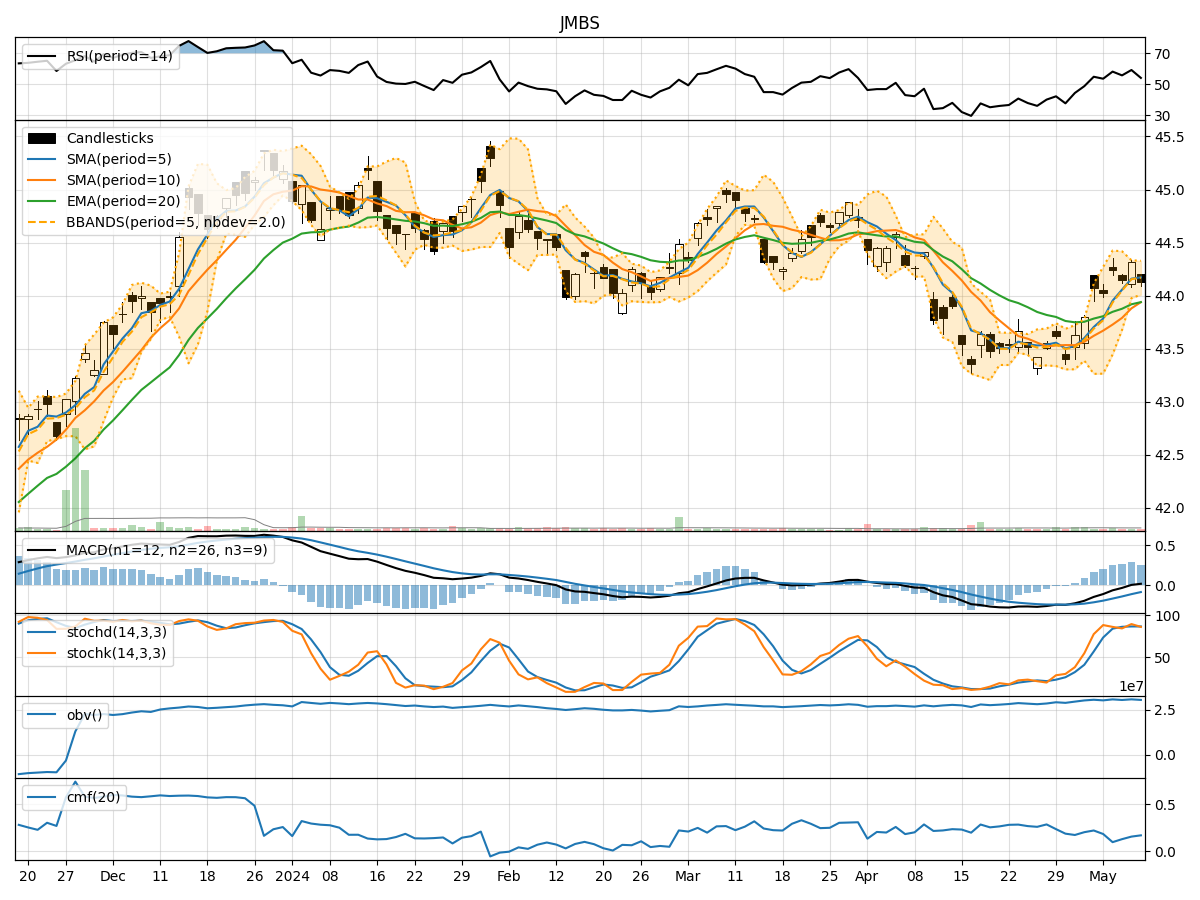
- Moving Averages (MA): The 5-day Moving Average (MA) has been consistently above the Simple Moving Average (SMA) and Exponential Moving Average (EMA), indicating a short-term uptrend.
- MACD: The MACD line has been positive, with the MACD Histogram showing an increasing trend, suggesting bullish momentum.
Momentum Analysis:
- RSI: The Relative Strength Index (RSI) has been fluctuating around the neutral zone, indicating a balanced momentum.
- Stochastic Oscillator: Both %K and %D have been in the overbought region, suggesting a potential reversal or consolidation.
Volatility Analysis:
- Bollinger Bands (BB): The stock price has been trading within the Bollinger Bands, with the bands narrowing, indicating decreasing volatility.
Volume Analysis:
- On-Balance Volume (OBV): The OBV has shown mixed signals, with no clear trend in volume accumulation or distribution.
- Chaikin Money Flow (CMF): The CMF has been positive, indicating buying pressure in the stock.
Key Observations:
- The trend indicators suggest a short-term uptrend in the stock price.
- Momentum indicators show a mixed sentiment with potential for a reversal.
- Volatility has been decreasing, indicating a possible period of consolidation.
- Volume indicators do not provide a clear direction, signaling uncertainty in market participation.
Conclusion:
Based on the analysis of the technical indicators, the next few days for JMBS stock could see sideways movement with a slight bias towards consolidation. The stock may trade within a narrow range as volatility decreases, while momentum remains uncertain. Traders should exercise caution and wait for clearer signals before taking significant positions.