Technical Analysis of JMEE 2024-05-10
Overview:
In analyzing the technical indicators for JMEE stock over the last 5 days, we will delve into the trend, momentum, volatility, and volume indicators to provide a comprehensive outlook on the possible stock price movement in the coming days. By examining these key indicators, we aim to offer valuable insights and predictions for informed decision-making.
Trend Indicators:
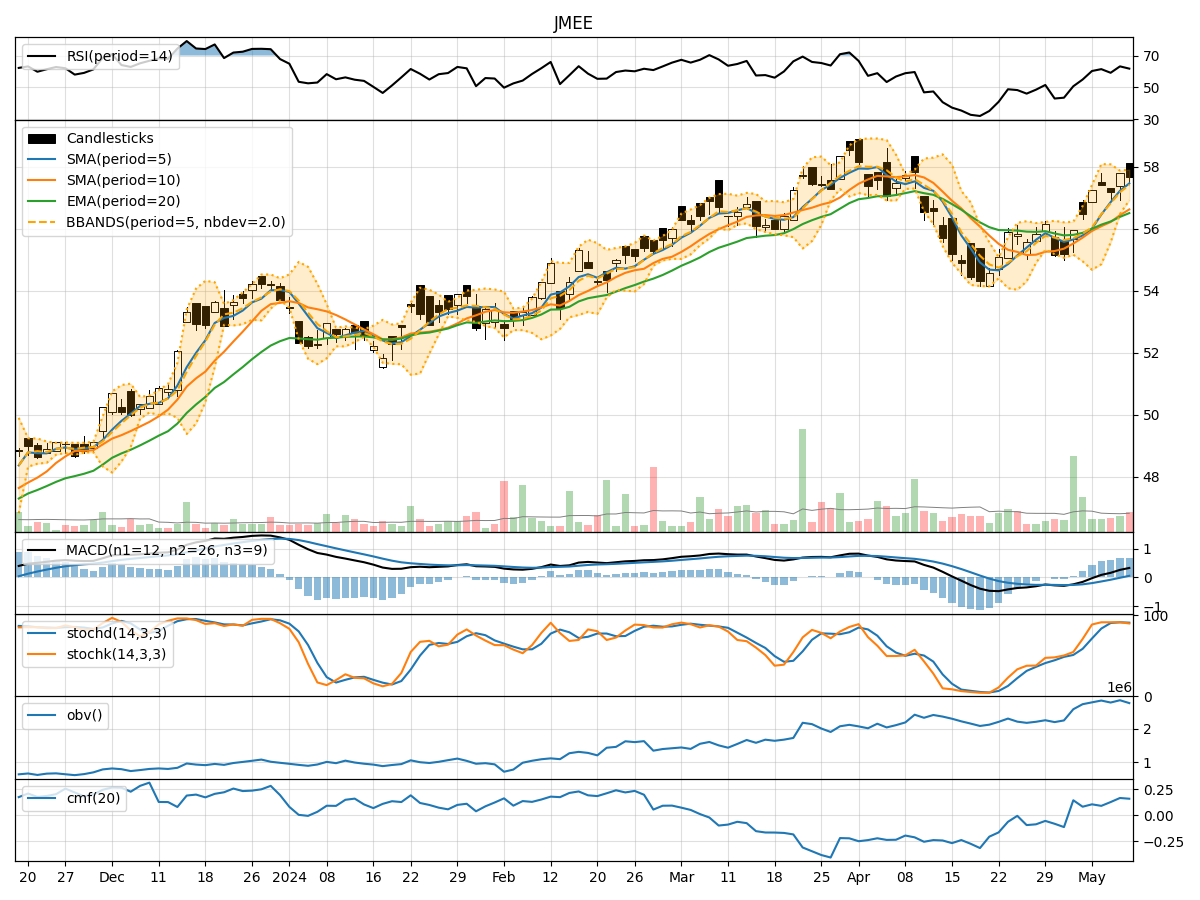
- Moving Averages (MA): The 5-day moving average has been consistently above the longer-term simple moving average (SMA) and exponential moving average (EMA), indicating a bullish trend.
- MACD: The MACD line has been consistently above the signal line, with both lines trending upwards, suggesting bullish momentum.
Momentum Indicators:
- RSI: The Relative Strength Index (RSI) has been fluctuating around the overbought territory, indicating strong buying pressure.
- Stochastic Oscillator: Both %K and %D lines have been in the overbought zone, signaling a potential reversal or consolidation.
Volatility Indicators:
- Bollinger Bands (BB): The stock price has been trading within the upper Bollinger Band, indicating an overbought condition.
Volume Indicators:
- On-Balance Volume (OBV): The OBV has been showing a slight increase, suggesting accumulation by investors.
- Chaikin Money Flow (CMF): The CMF has been positive, indicating buying pressure in the stock.
Key Observations and Opinions:
- Trend: The stock is in a strong bullish trend based on moving averages and MACD.
- Momentum: The RSI and Stochastic Oscillator suggest overbought conditions, potentially leading to a short-term pullback.
- Volatility: The stock is currently overbought according to Bollinger Bands, indicating a possible reversal or consolidation.
- Volume: The OBV and CMF show positive signs of accumulation and buying pressure.
Conclusion:
Based on the technical indicators and analysis: - Short-Term View: The stock may experience a short-term pullback or consolidation due to overbought conditions indicated by momentum and volatility indicators. - Long-Term View: The overall trend remains bullish, supported by moving averages and MACD, suggesting potential for further upside in the long run.
Recommendation:
- Immediate Action: Consider taking profits or tightening stop-loss levels in the short term.
- Long-Term Strategy: Hold onto the stock for potential further gains, considering the strong bullish trend indicated by trend indicators.
Final Verdict:
The stock is likely to experience a short-term pullback or consolidation before potentially resuming its bullish trend in the long run. Investors should monitor key levels and indicators for strategic decision-making.