Technical Analysis of JMUB 2024-05-10
Overview:
In analyzing the technical indicators for JMUB over the last 5 days, we will delve into the trend, momentum, volatility, and volume indicators to provide a comprehensive outlook on the possible stock price movement in the coming days. By examining these key indicators, we aim to offer valuable insights and recommendations for potential investors.
Trend Analysis:
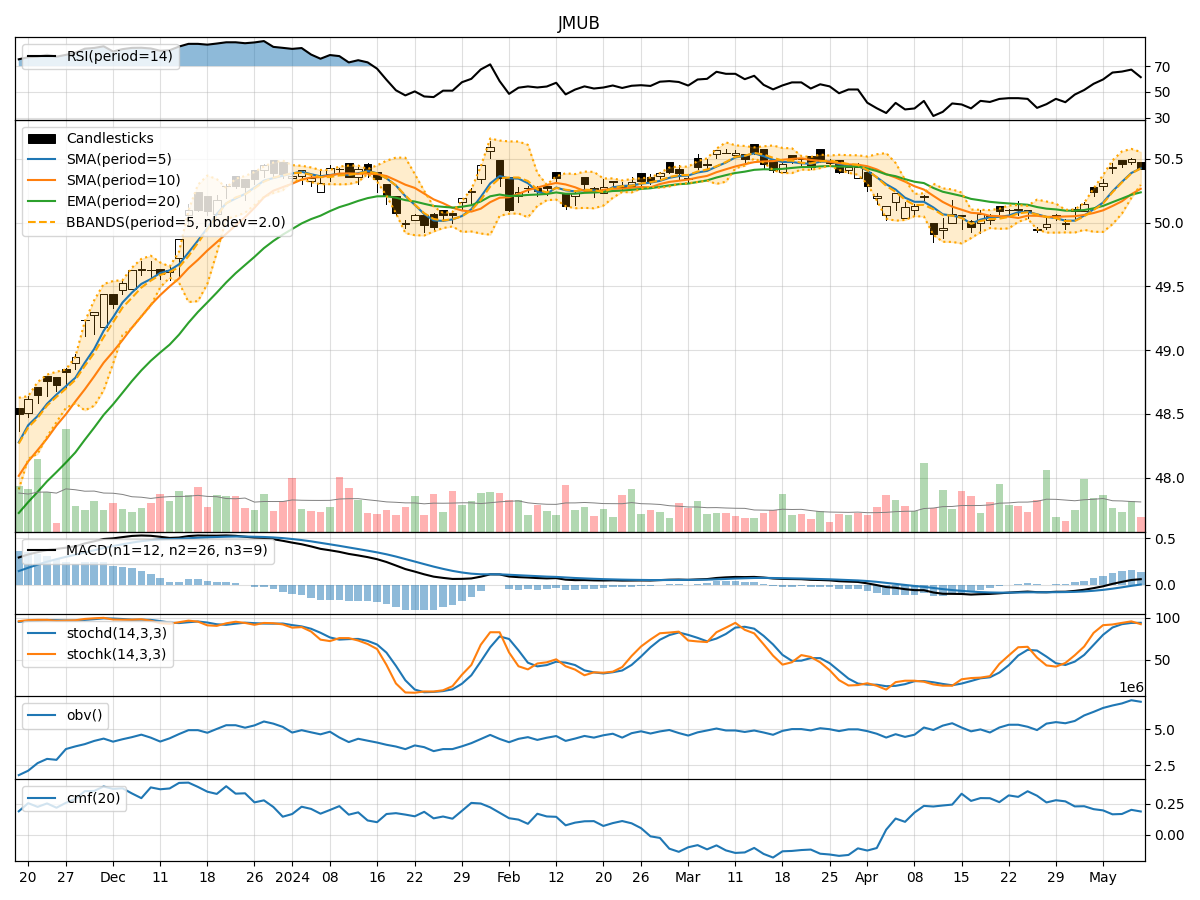
- Moving Averages (MA): The 5-day Moving Average (MA) has been consistently above the Simple Moving Average (SMA) and Exponential Moving Average (EMA), indicating a bullish trend.
- MACD: The MACD line has been consistently above the signal line, with the MACD Histogram showing positive values, suggesting a bullish momentum.
Momentum Analysis:
- RSI: The Relative Strength Index (RSI) has been in the overbought territory, indicating a strong bullish momentum.
- Stochastic Oscillator: Both %K and %D lines of the Stochastic Oscillator have been in the overbought zone, suggesting a potential reversal or consolidation.
Volatility Analysis:
- Bollinger Bands (BB): The stock price has been trading within the Bollinger Bands, with the bands narrowing, indicating decreasing volatility.
Volume Analysis:
- On-Balance Volume (OBV): The OBV has shown a positive trend, indicating accumulation by investors.
- Chaikin Money Flow (CMF): The CMF has been positive, suggesting buying pressure in the stock.
Key Observations:
- The trend indicators suggest a strong bullish sentiment in the stock.
- Momentum indicators indicate a potential overbought condition, signaling a caution for investors.
- Volatility has been decreasing, which may lead to a period of consolidation.
- Volume indicators show positive accumulation and buying pressure.
Conclusion:
Based on the analysis of the technical indicators, the stock price of JMUB is likely to experience further upward movement in the coming days. However, considering the overbought signals from the momentum indicators, there might be a short-term consolidation or pullback before the uptrend resumes. Investors should closely monitor the price action and key support levels for potential entry or exit points.
Recommendation:
- Short-term Traders: Consider taking profits or setting tight stop-loss orders to protect gains during a potential consolidation phase.
- Long-term Investors: Hold onto positions with a focus on key support levels for potential accumulation opportunities.
Disclaimer:
This analysis is based solely on technical indicators and does not take into account fundamental factors or external market influences. It is essential to conduct thorough research and consider multiple indicators before making any investment decisions. Consulting with a financial advisor is recommended for personalized investment advice tailored to individual risk tolerance and financial goals.