Technical Analysis of JOET 2024-05-10
Overview:
In analyzing the technical indicators for JOET stock over the last 5 days, we will delve into the trends, momentum, volatility, and volume indicators to provide a comprehensive outlook on the possible stock price movement in the coming days.
Trend Analysis:
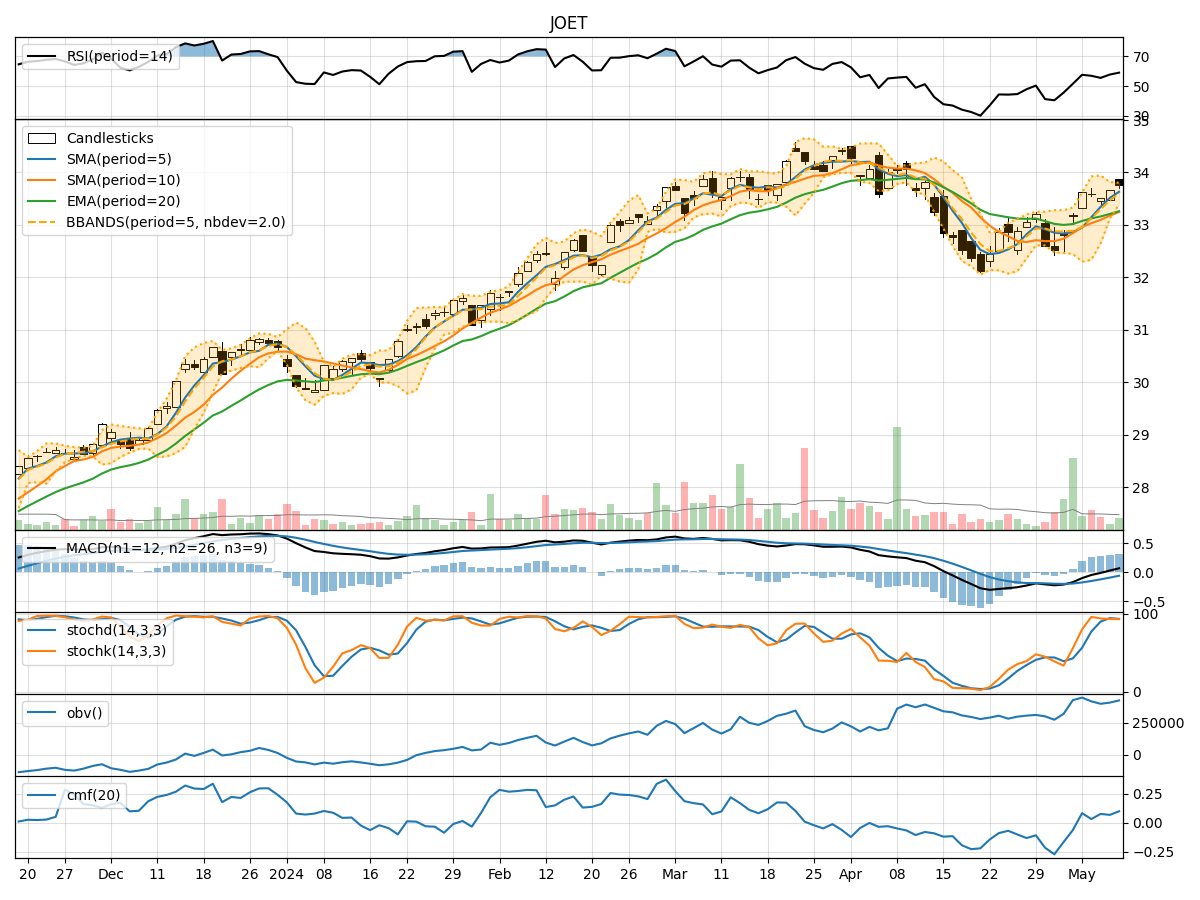
- Moving Averages (MA): The 5-day Moving Average (MA) has been consistently above the Simple Moving Average (SMA) and Exponential Moving Average (EMA), indicating a bullish trend.
- MACD: The Moving Average Convergence Divergence (MACD) has been positive, with the MACD line above the Signal line, suggesting upward momentum.
- Conclusion: The trend indicators point towards an upward trend for JOET stock.
Momentum Analysis:
- RSI: The Relative Strength Index (RSI) has been in the neutral to slightly overbought territory, indicating moderate buying pressure.
- Stochastic Oscillator: Both %K and %D have been in the overbought zone, suggesting a potential reversal.
- Conclusion: The momentum indicators signal a cautious view, with a possibility of a pullback in the short term.
Volatility Analysis:
- Bollinger Bands (BB): The stock price has been trading within the Bollinger Bands, with the bands narrowing, indicating decreasing volatility.
- Conclusion: Volatility is decreasing, suggesting a potential consolidation phase or a sideways movement in the near future.
Volume Analysis:
- On-Balance Volume (OBV): The OBV has shown mixed signals, with fluctuations in volume but no clear trend.
- Chaikin Money Flow (CMF): The CMF has been positive, indicating buying pressure.
- Conclusion: Volume indicators are inconclusive, suggesting uncertainty in market participation.
Overall Conclusion:
Based on the analysis of trend, momentum, volatility, and volume indicators, the next few days for JOET stock could see a continuation of the upward trend with potential for a pullback due to overbought conditions in momentum indicators. The decreasing volatility may lead to a consolidation phase or sideways movement in the stock price. However, the mixed signals in volume indicators indicate uncertainty in market participation, which could impact the stock price movement.
Recommendation:
- Short Term: Consider taking profits if the stock price continues to rise and monitor for signs of a potential pullback.
- Long Term: Evaluate the overall market conditions and company fundamentals to make informed decisions on holding or selling the stock.
Disclaimer:
Remember that technical analysis is not a guaranteed predictor of future price movements, and other fundamental factors can influence stock prices. It is essential to conduct thorough research and consider multiple indicators before making investment decisions. Consulting with a financial advisor is recommended for personalized guidance tailored to your investment goals and risk tolerance level.