Technical Analysis of JOJO 2024-05-10
Overview:
In analyzing the technical indicators for JOJO stock over the last 5 days, we will delve into the trend, momentum, volatility, and volume indicators to provide a comprehensive outlook on the possible stock price movement in the coming days. By examining these key aspects, we aim to offer valuable insights and predictions for potential investors.
Trend Analysis:
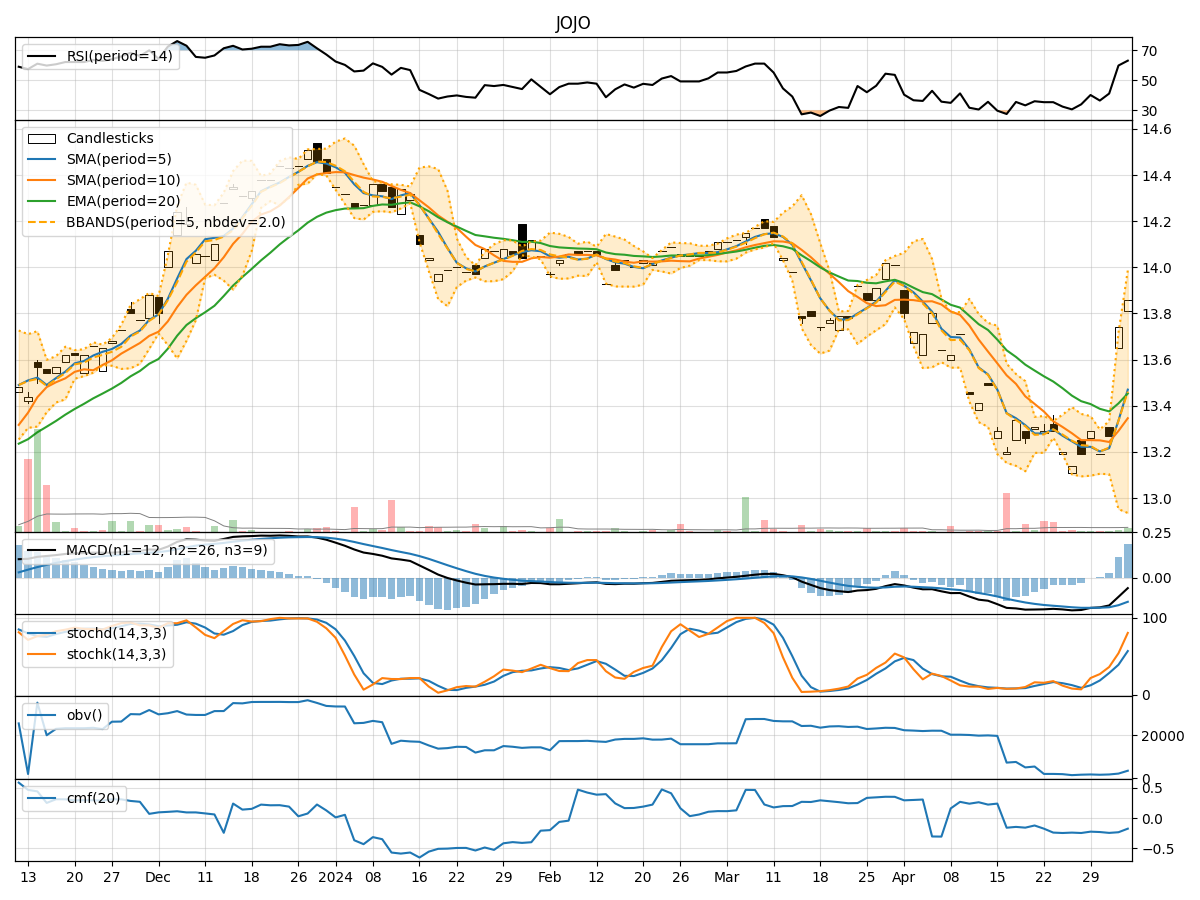
- Moving Averages (MA): The 5-day Moving Average (MA) has been consistently above the Simple Moving Average (SMA) and Exponential Moving Average (EMA), indicating a bullish trend.
- MACD: The MACD line has been consistently above the signal line, with both lines trending upwards, suggesting a bullish momentum.
Momentum Analysis:
- RSI: The Relative Strength Index (RSI) has been fluctuating around the 60-70 range, indicating a neutral momentum.
- Stochastic Oscillator: Both %K and %D have been gradually decreasing but remain in the overbought territory, signaling a potential reversal.
Volatility Analysis:
- Bollinger Bands (BB): The stock price has been trading within the Bollinger Bands, with the bands narrowing, suggesting a decrease in volatility.
Volume Analysis:
- On-Balance Volume (OBV): The OBV has been showing a slight decline, indicating a decrease in buying pressure.
- Chaikin Money Flow (CMF): The CMF has been negative, suggesting a lack of buying interest over the 20-day period.
Key Observations:
- The trend indicators point towards a bullish sentiment in the short term.
- Momentum indicators show a neutral stance with a potential reversal in the stochastic oscillator.
- Volatility is decreasing, indicating a possible period of consolidation.
- Volume indicators suggest a decrease in buying pressure and lack of significant buying interest.
Conclusion:
Based on the analysis of the technical indicators, the next few days for JOJO stock are likely to see sideways movement with a slight bearish bias. Investors should exercise caution and closely monitor the stochastic oscillator for a potential reversal signal. It is advisable to wait for clearer signals before making any significant trading decisions.