Technical Analysis of JPAN 2024-05-10
Overview:
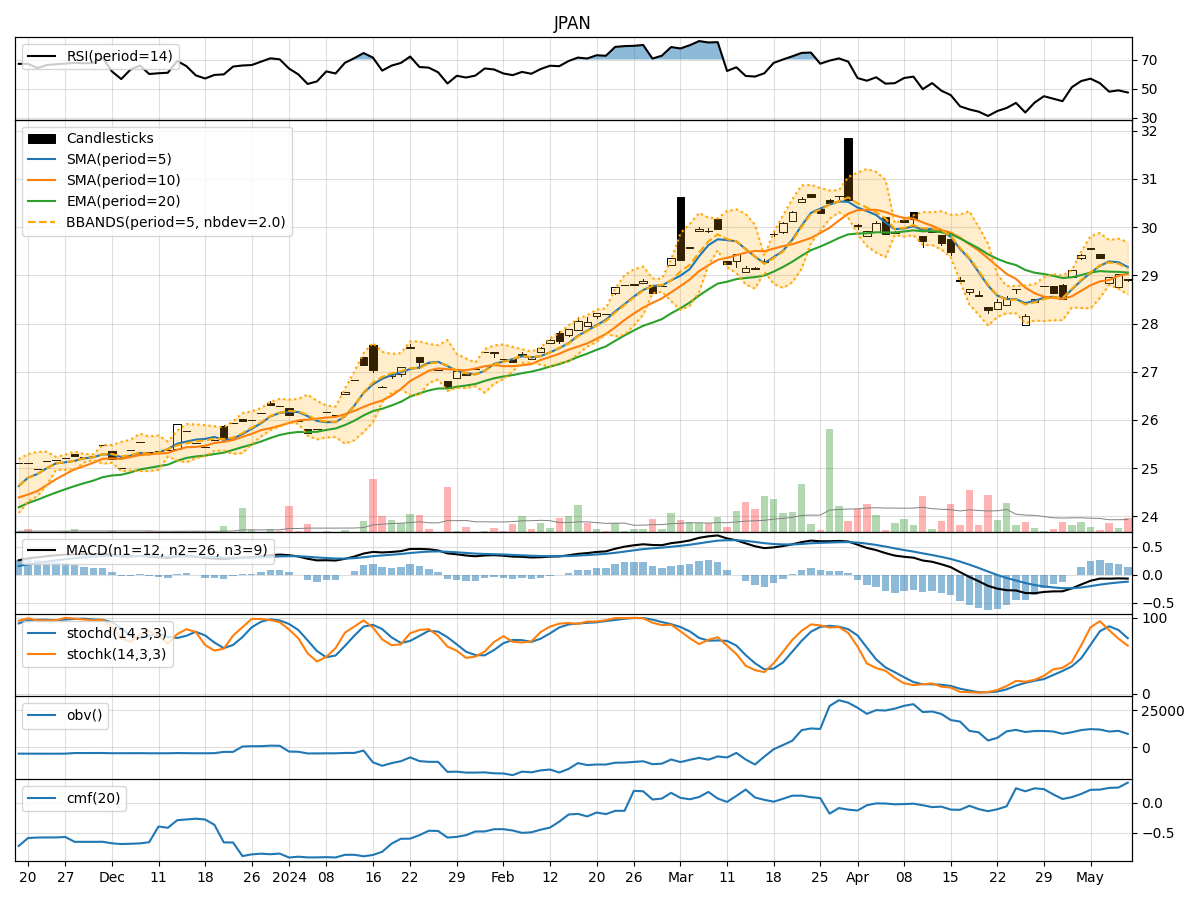
In analyzing the technical indicators for JPAN stock over the last 5 days, we will delve into the trends, momentum, volatility, and volume aspects to provide a comprehensive outlook on the possible future stock price movement. By examining key indicators such as moving averages, MACD, RSI, Bollinger Bands, and OBV, we aim to offer valuable insights and predictions for the upcoming trading days.
Trend Analysis:
- Moving Averages (MA): The 5-day moving average has been fluctuating around the current price, indicating a lack of clear trend direction.
- MACD: The MACD line has been consistently below the signal line, suggesting a bearish momentum in the short term.
- EMA: The exponential moving average has been relatively stable, reflecting a neutral trend.
Key Observation: The trend indicators show mixed signals with a slight bearish bias.
Momentum Analysis:
- RSI: The RSI has been hovering around the 50 level, indicating a balanced momentum between buying and selling pressure.
- Stochastic Oscillator: Both %K and %D have been declining, signaling a potential weakening of the bullish momentum.
- Williams %R: The Williams %R is in the oversold territory, suggesting a possible reversal in the short term.
Key Observation: Momentum indicators point towards a neutral to slightly bearish sentiment.
Volatility Analysis:
- Bollinger Bands: The price has been trading within the Bollinger Bands, indicating a period of consolidation.
- Bollinger Band Width: The band width has been narrowing, suggesting a decrease in volatility.
Key Observation: Volatility indicators signal a period of consolidation and potential price stability.
Volume Analysis:
- On-Balance Volume (OBV): The OBV has been fluctuating without a clear trend, reflecting indecision among market participants.
- Chaikin Money Flow (CMF): The CMF has been positive but relatively flat, indicating a neutral money flow trend.
Key Observation: Volume indicators show a lack of strong buying or selling pressure.
Conclusion:
Based on the analysis of the technical indicators, the next few days for JPAN stock are likely to see sideways movement with a slight bearish bias. The stock may continue to consolidate within a narrow range, as indicated by the volatility and volume indicators. Traders should exercise caution and wait for clearer signals before making significant trading decisions.