Technical Analysis of JPEM 2024-05-10
Overview:
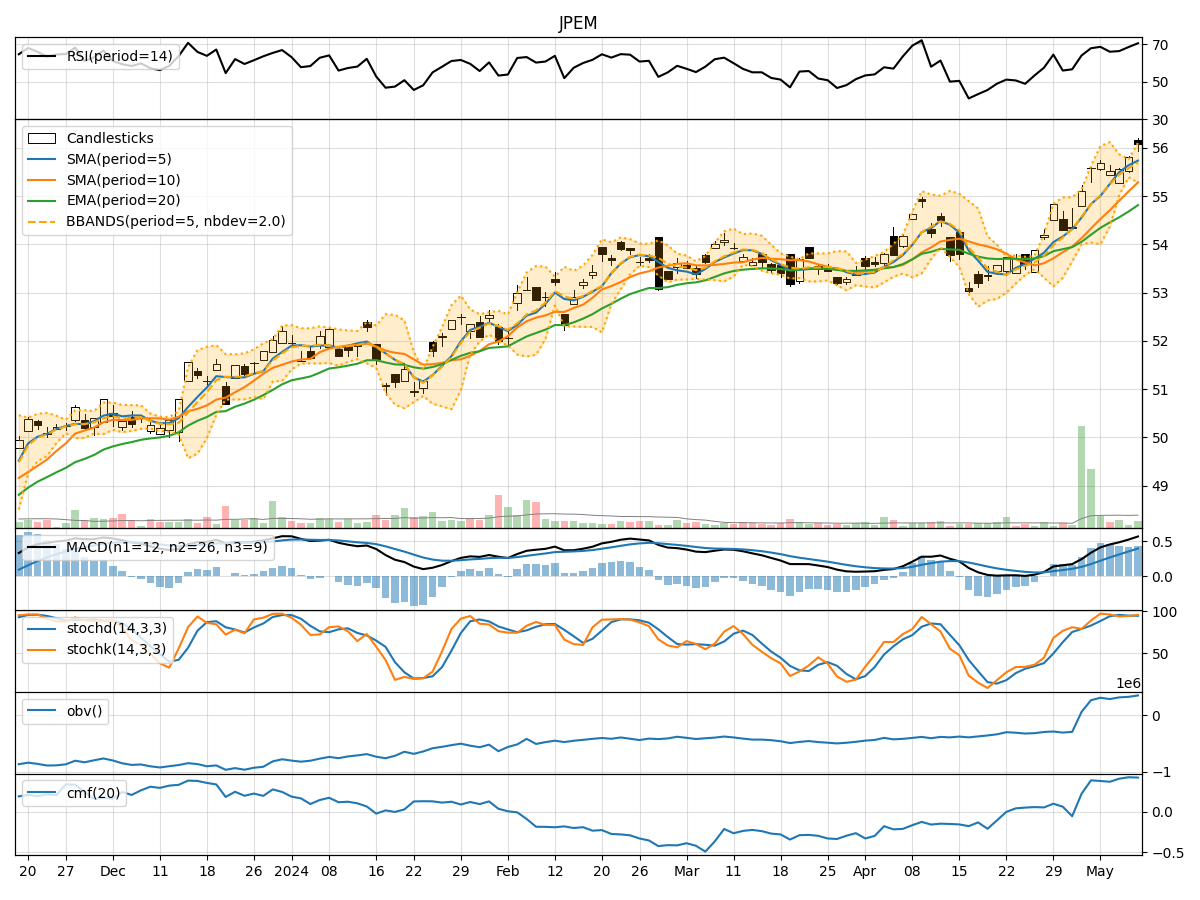
In analyzing the technical indicators for JPEM over the last 5 days, we will delve into the trend, momentum, volatility, and volume indicators to provide a comprehensive outlook on the possible stock price movement in the coming days. By examining these key indicators, we aim to offer valuable insights and recommendations for potential investors.
Trend Indicators:
- Moving Averages (MA): The 5-day moving average has been consistently above the 10-day simple moving average, indicating a short-term bullish trend.
- Exponential Moving Average (EMA): The EMA has been steadily increasing, reflecting positive price momentum.
- Moving Average Convergence Divergence (MACD): The MACD line has been above the signal line, suggesting bullish momentum.
- Conclusion: The trend indicators point towards an upward trend in the stock price.
Momentum Indicators:
- Relative Strength Index (RSI): The RSI has been in the overbought territory, indicating strong buying pressure.
- Stochastic Oscillator (Stoch): Both %K and %D have been in the overbought zone, signaling potential for a reversal.
- Williams %R (WillR): The Williams %R has been fluctuating around the oversold region, suggesting a possible reversal.
- Conclusion: The momentum indicators suggest a potential pullback or consolidation in the stock price.
Volatility Indicators:
- Bollinger Bands (BB): The stock price has been trading within the upper Bollinger Band, indicating increased volatility.
- Conclusion: The volatility indicators imply a volatile trading environment for the stock.
Volume Indicators:
- On-Balance Volume (OBV): The OBV has been showing a positive trend, indicating accumulation by investors.
- Chaikin Money Flow (CMF): The CMF has been positive, suggesting buying pressure in the stock.
- Conclusion: The volume indicators point towards positive accumulation and buying interest in the stock.
Overall Conclusion:
Based on the analysis of the technical indicators, the stock of JPEM is likely to experience upward momentum in the short term, supported by the trend indicators. However, the overbought conditions highlighted by the momentum indicators suggest a potential pullback or consolidation in the near future. The volatility indicators indicate a volatile trading environment, which could lead to sharp price movements. The positive volume indicators signal accumulation and buying interest in the stock.
Recommendation:
Considering the overall analysis, it is advisable to exercise caution and closely monitor the stock price for any signs of a reversal or consolidation. Investors may consider taking profits if the stock price continues to rise without a significant pullback. Additionally, setting stop-loss orders to protect gains and manage risk is recommended in this volatile market environment.
Disclaimer:
Please note that technical analysis is not a guaranteed predictor of future price movements, and other fundamental factors can influence stock prices. It is essential to conduct thorough research and consider multiple indicators before making any investment decisions. Consulting with a financial advisor for personalized advice is always recommended.