Technical Analysis of JPIE 2024-05-10
Overview:
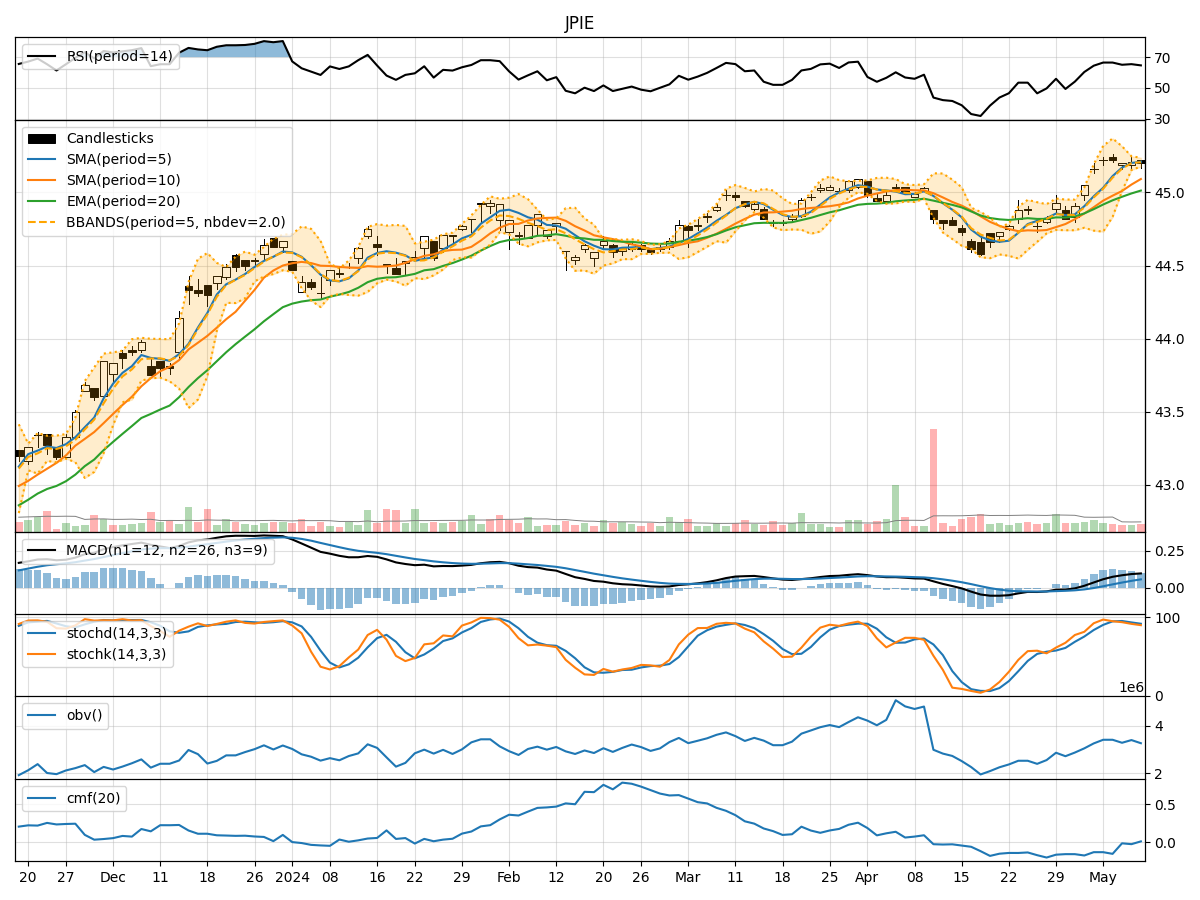
In analyzing the technical indicators for JPIE over the last 5 days, we will delve into the trend, momentum, volatility, and volume indicators to provide a comprehensive outlook on the possible stock price movement in the coming days.
Trend Analysis:
- Moving Averages (MA): The 5-day Moving Average (MA) has been consistently above the Simple Moving Average (SMA) and Exponential Moving Average (EMA), indicating a bullish trend.
- MACD: The MACD line has been consistently above the signal line, with both lines showing an upward trend, suggesting bullish momentum.
- RSI: The Relative Strength Index (RSI) has been fluctuating around the overbought territory, indicating strong buying pressure.
Momentum Analysis:
- Stochastic Oscillator: The Stochastic Oscillator has been gradually decreasing but remains in the overbought zone, suggesting a potential reversal in momentum.
- Williams %R: The Williams %R indicator has been consistently in the oversold territory, indicating a potential buying opportunity.
Volatility Analysis:
- Bollinger Bands (BB): The Bollinger Bands have been narrowing, indicating decreasing volatility and a possible period of consolidation.
- Average True Range (ATR): The ATR has been relatively stable, suggesting a lack of significant price fluctuations.
Volume Analysis:
- On-Balance Volume (OBV): The OBV has been fluctuating, indicating mixed buying and selling pressure.
- Chaikin Money Flow (CMF): The CMF has been negative, suggesting a lack of strong buying interest.
Key Observations:
- The trend indicators suggest a bullish sentiment, supported by the MACD and moving averages.
- Momentum indicators show a potential reversal in momentum, with the Stochastic Oscillator signaling a shift.
- Volatility indicators point towards a period of consolidation, as seen in the narrowing Bollinger Bands.
- Volume indicators reflect mixed trading activity, with no clear direction in buying or selling pressure.
Conclusion:
Based on the analysis of the technical indicators, the next few days for JPIE are likely to see sideways movement with a slight bullish bias. Traders should monitor the Stochastic Oscillator for a potential reversal in momentum and watch for any breakout or breakdown from the current consolidation phase. It is advisable to wait for confirmation from key indicators before making any significant trading decisions.