Technical Analysis of JPIN 2024-05-10
Overview:
In analyzing the technical indicators for JPIN over the last 5 days, we will delve into the trend, momentum, volatility, and volume indicators to provide a comprehensive outlook on the possible stock price movement in the coming days. By examining these key aspects, we aim to offer valuable insights and predictions to guide your investment decisions.
Trend Analysis:
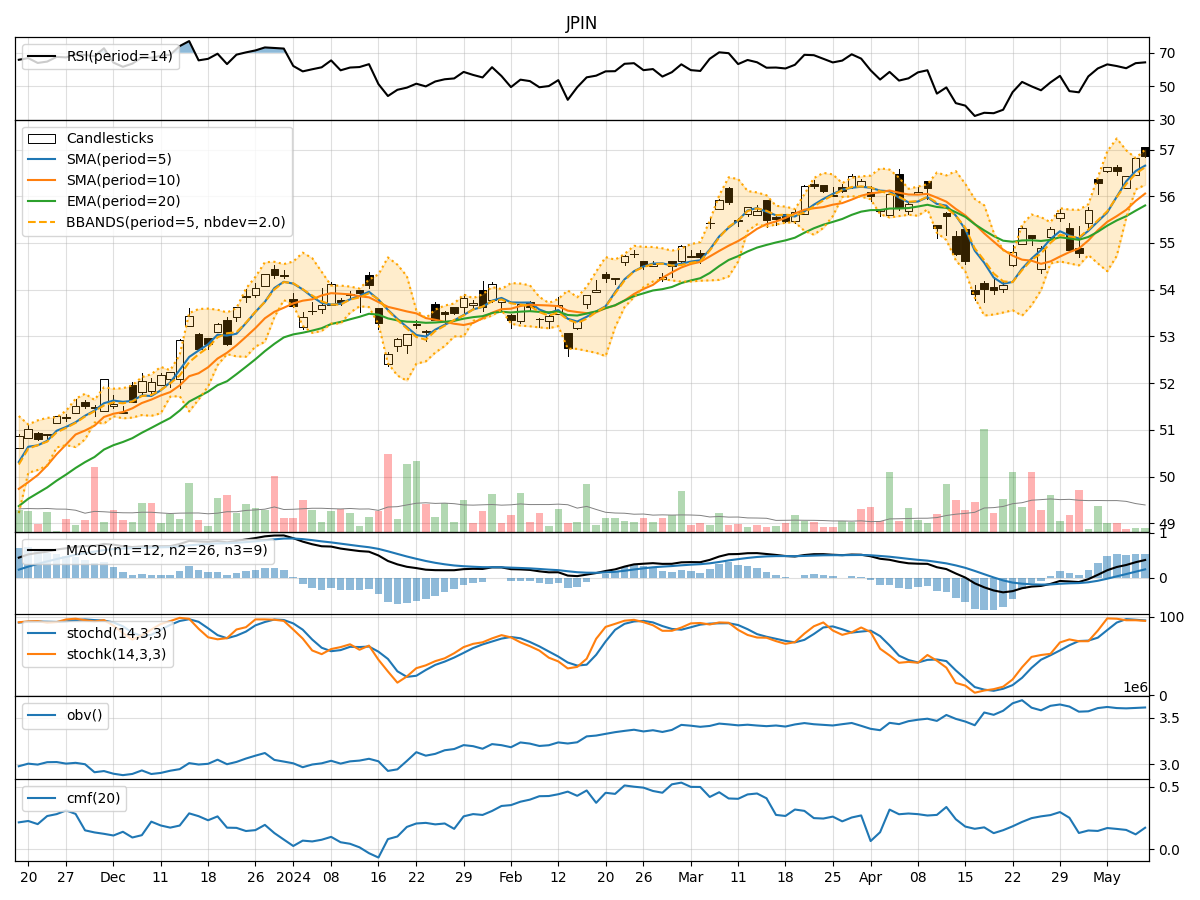
- Moving Averages (MA): The 5-day Moving Average (MA) has been consistently above the Simple Moving Average (SMA) and Exponential Moving Average (EMA), indicating a bullish trend.
- MACD: The MACD and Signal Line have shown positive values, with the MACD Histogram also trending upwards, suggesting bullish momentum.
Momentum Analysis:
- RSI: The Relative Strength Index (RSI) has been fluctuating in the overbought region, indicating strong buying pressure.
- Stochastic Oscillator: Both %K and %D have been relatively high, signaling potential overbought conditions.
- Williams %R: The Williams %R has been hovering around oversold levels, suggesting a possible reversal.
Volatility Analysis:
- Bollinger Bands (BB): The stock price has been trading within the Bollinger Bands, with the bands narrowing, indicating decreasing volatility.
- Bollinger %B: The %B indicator has been fluctuating around the middle range, reflecting a neutral stance.
Volume Analysis:
- On-Balance Volume (OBV): The OBV has shown a slight increase, indicating accumulation by investors.
- Chaikin Money Flow (CMF): The CMF has been positive, suggesting buying pressure in the stock.
Key Observations:
- The trend indicators suggest a bullish sentiment, supported by the positive MACD values.
- Momentum indicators show conflicting signals, with RSI indicating strength but Stochastic Oscillator hinting at potential overbought conditions.
- Volatility has been decreasing, as seen in the narrowing Bollinger Bands.
- Volume indicators point towards accumulation and positive money flow into the stock.
Conclusion:
Based on the analysis of the technical indicators, the overall outlook for JPIN in the next few days is bullish. The trend remains positive, supported by the momentum and volume indicators. However, caution is advised due to the conflicting signals in the momentum indicators, which could lead to short-term fluctuations. Traders may consider entering long positions with proper risk management strategies in place to capitalize on the expected upward movement in the stock price.