Technical Analysis of JPMO 2024-05-10
Overview:
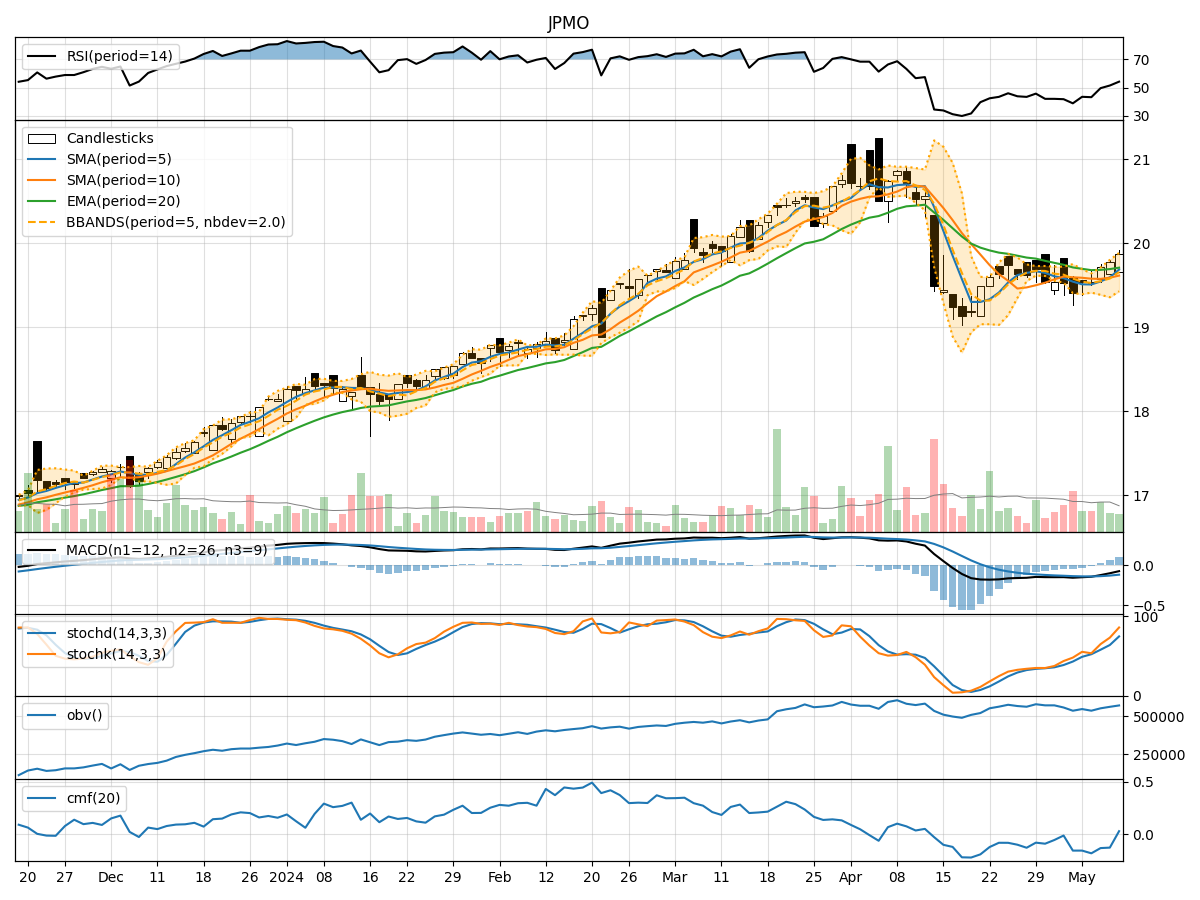
In analyzing the technical indicators for JPMO over the last 5 days, we will delve into the trend, momentum, volatility, and volume indicators to provide a comprehensive outlook on the possible stock price movement in the coming days. By examining these key indicators, we aim to offer valuable insights and predictions for informed decision-making.
Trend Analysis:
- Moving Averages (MA): The 5-day Moving Average (MA) has been showing an upward trend, indicating a positive momentum in the stock price.
- MACD: The Moving Average Convergence Divergence (MACD) has been consistently negative but showing signs of improvement towards the end of the period.
- EMA: The Exponential Moving Average (EMA) has been relatively stable, suggesting a potential consolidation phase.
Momentum Analysis:
- RSI: The Relative Strength Index (RSI) has been gradually increasing, indicating strengthening momentum.
- Stochastic Oscillator: Both %K and %D of the Stochastic Oscillator have been rising, reflecting bullish momentum.
- Williams %R: The Williams %R is also showing an upward trend, signaling a potential buying opportunity.
Volatility Analysis:
- Bollinger Bands (BB): The Bollinger Bands have been widening, suggesting increased volatility in the stock price.
- BB %B: The %B indicator is hovering around the middle range, indicating a neutral stance in terms of volatility.
Volume Analysis:
- On-Balance Volume (OBV): The OBV has been increasing steadily, indicating accumulation by investors.
- Chaikin Money Flow (CMF): The CMF has been negative but showing signs of improvement, suggesting a potential shift towards buying pressure.
Conclusion:
Based on the analysis of the technical indicators, the next few days' possible stock price movement for JPMO appears to be bullish. The positive trends in moving averages, improving MACD, strengthening momentum indicators, and increasing OBV point towards a potential upward movement in the stock price. However, the widening Bollinger Bands indicate heightened volatility, which investors should monitor closely. Overall, the technical analysis suggests a favorable outlook for JPMO in the coming days, with a higher probability of upward price movement.