Technical Analysis of JPRE 2024-05-10
Overview:
In analyzing the technical indicators for JPRE stock over the last 5 days, we will delve into the trend, momentum, volatility, and volume indicators to provide a comprehensive outlook on the possible stock price movement in the coming days. By examining these key aspects, we aim to offer valuable insights and predictions for informed decision-making.
Trend Analysis:
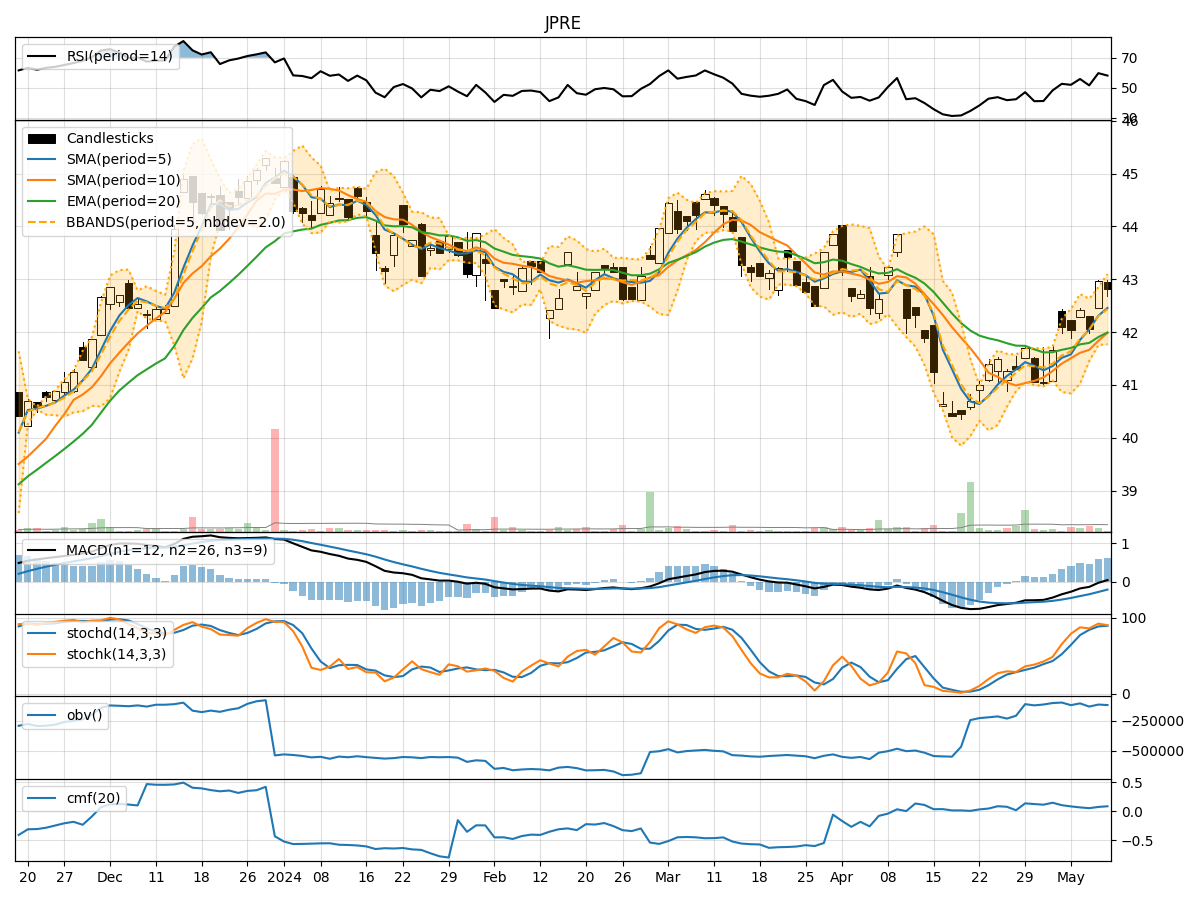
- Moving Averages (MA): The 5-day Moving Average (MA) has been trending above the Simple Moving Average (SMA) and Exponential Moving Average (EMA), indicating a short-term bullish trend.
- MACD: The Moving Average Convergence Divergence (MACD) has shown positive values, with the MACD line consistently above the Signal line, suggesting bullish momentum.
- RSI: The Relative Strength Index (RSI) has been fluctuating around the neutral zone, indicating a balanced market sentiment.
Momentum Analysis:
- Stochastic Oscillator: The Stochastic Oscillator has been in the overbought region, suggesting a potential reversal or consolidation phase.
- Williams %R: The Williams %R indicator has been hovering in the oversold territory, signaling a possible buying opportunity.
Volatility Analysis:
- Bollinger Bands (BB): The Bollinger Bands have shown narrowing bands, indicating decreasing volatility and a potential price breakout in the near future.
- Average True Range (ATR): The ATR has been relatively stable, suggesting a lack of significant price fluctuations.
Volume Analysis:
- On-Balance Volume (OBV): The OBV indicator has shown mixed signals, reflecting indecision among market participants.
- Chaikin Money Flow (CMF): The CMF has been positive, indicating buying pressure in the market.
Key Observations:
- The trend indicators suggest a bullish bias in the short term.
- Momentum indicators point towards a potential reversal or consolidation phase.
- Volatility indicators indicate a possible breakout scenario.
- Volume indicators reflect mixed signals with a slight buying pressure.
Conclusion:
Based on the analysis of the technical indicators, the next few days' possible stock price movement for JPRE is likely to experience consolidation or a sideways trend. Traders should closely monitor the Stochastic Oscillator and Williams %R for potential reversal signals, while keeping an eye on the Bollinger Bands for any breakout opportunities. Overall, the stock is expected to trade within a range with no clear directional bias in the immediate future.