Technical Analysis of JPSE 2024-05-10
Overview:
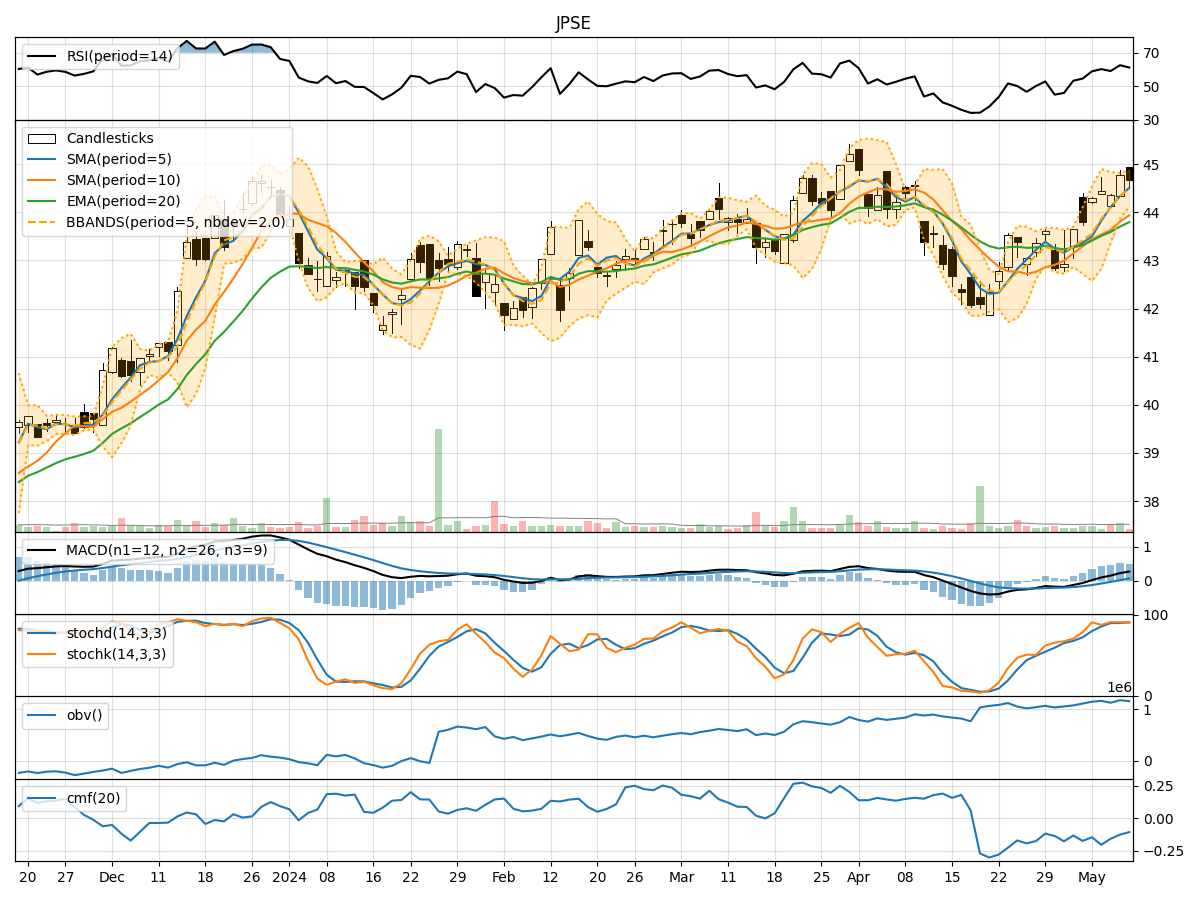
In analyzing the technical indicators for JPSE over the last 5 days, we will delve into the trend, momentum, volatility, and volume indicators to provide a comprehensive outlook on the possible stock price movement in the coming days. By examining these key aspects, we aim to offer valuable insights and recommendations for potential investors.
Trend Analysis:
- Moving Averages (MA): The 5-day Moving Average (MA) has been consistently above the Simple Moving Average (SMA) and Exponential Moving Average (EMA), indicating a bullish trend.
- MACD: The MACD line has been consistently above the signal line, with the MACD Histogram showing positive values, suggesting a bullish momentum in the short term.
Momentum Analysis:
- RSI: The Relative Strength Index (RSI) has been fluctuating around the 60-62 range, indicating a neutral momentum.
- Stochastic Oscillator: Both %K and %D have been hovering around the overbought zone, suggesting a potential reversal or consolidation.
Volatility Analysis:
- Bollinger Bands (BB): The stock price has been trading within the Bollinger Bands, with the bands narrowing, indicating decreasing volatility.
- Bollinger %B: The %B indicator has been fluctuating around 0.7, suggesting the stock is trading closer to the upper band.
Volume Analysis:
- On-Balance Volume (OBV): The OBV indicator has been relatively stable, indicating a balance between buying and selling pressure.
- Chaikin Money Flow (CMF): The CMF has been negative, indicating a slight outflow of money from the stock.
Key Observations:
- The trend indicators suggest a bullish sentiment in the short term.
- Momentum indicators show a neutral stance with a potential for a reversal.
- Volatility has been decreasing, indicating a possible period of consolidation.
- Volume indicators reflect a balanced buying and selling pressure with a slight outflow of money.
Conclusion:
Based on the analysis of the technical indicators, the next few days for JPSE are likely to see sideways movement with a slight bullish bias. Traders should exercise caution as the stock may experience a period of consolidation before potentially resuming its upward trend. It is advisable to closely monitor key support and resistance levels for potential entry and exit points.
Recommendation:
- Short-term Traders: Consider taking profits on existing positions and wait for clearer signals before entering new trades.
- Long-term Investors: Hold onto positions with a watchful eye on key technical levels for potential adjustments to the portfolio.
By combining the insights from trend, momentum, volatility, and volume indicators, investors can make more informed decisions aligned with the current market dynamics.