Technical Analysis of JPSV 2024-05-10
Overview:
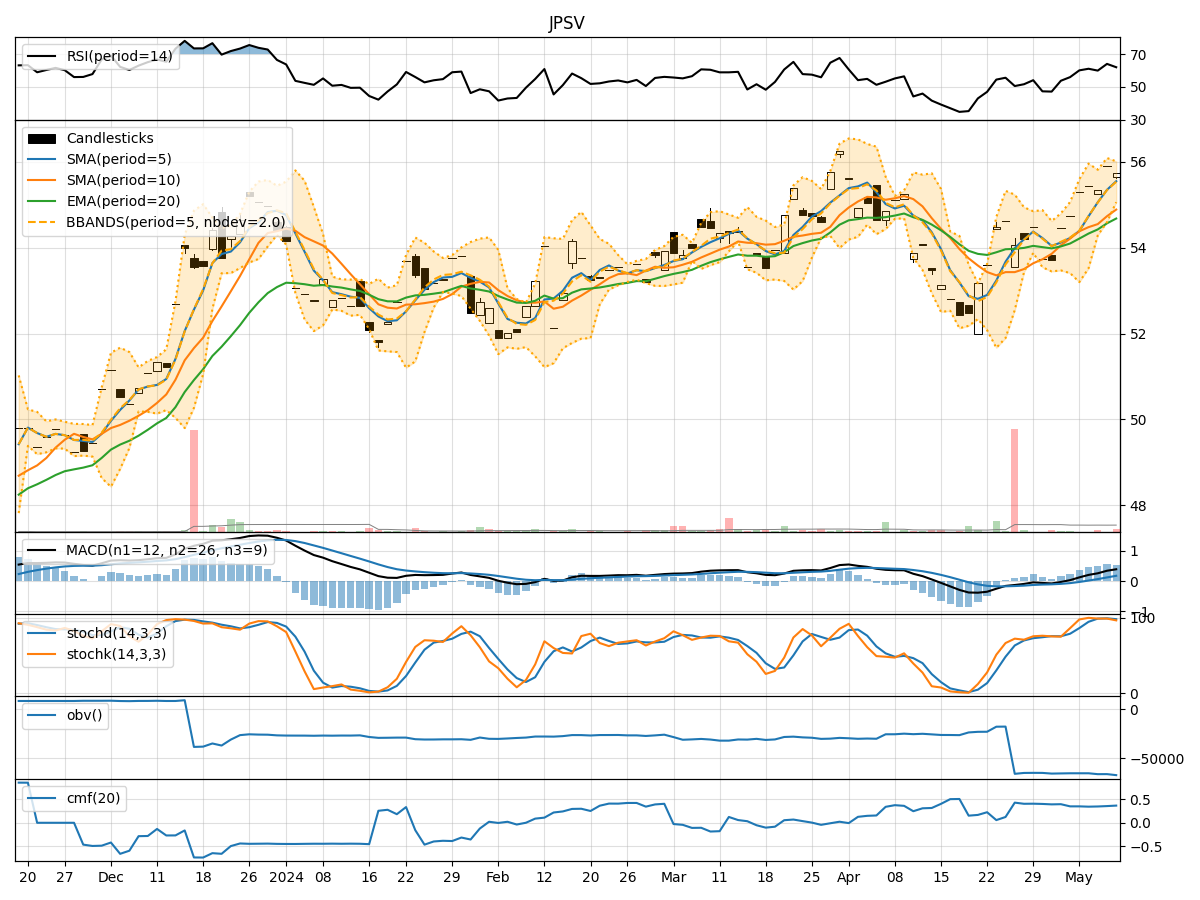
In analyzing the technical indicators for JPSV over the last 5 days, we will delve into the trends, momentum, volatility, and volume indicators to provide a comprehensive outlook on the possible stock price movement in the coming days. By examining these key aspects, we aim to offer valuable insights and recommendations for potential investors.
Trend Indicators:
- Moving Averages (MA): The 5-day moving average has been consistently above the simple moving average (SMA) and exponential moving average (EMA), indicating a bullish trend.
- MACD: The MACD line has been consistently above the signal line, suggesting a positive momentum in the stock price.
Momentum Indicators:
- RSI: The Relative Strength Index (RSI) has been fluctuating around the overbought territory, indicating strong buying momentum.
- Stochastic Oscillator: Both %K and %D have been relatively high, signaling a potential continuation of the bullish momentum.
Volatility Indicators:
- Bollinger Bands (BB): The stock price has been trading within the bands, with the upper band acting as a resistance level and the lower band as a support level.
Volume Indicators:
- On-Balance Volume (OBV): The OBV has been fluctuating, indicating mixed buying and selling pressure.
- Chaikin Money Flow (CMF): The CMF has been positive, suggesting a bullish money flow into the stock.
Key Observations and Opinions:
- Trend: The stock is in an upward trend based on moving averages and MACD.
- Momentum: The momentum indicators suggest a bullish sentiment with strong buying pressure.
- Volatility: The stock price is experiencing moderate volatility within the Bollinger Bands.
- Volume: The volume indicators show mixed signals with fluctuating OBV and positive CMF.
Conclusion:
Based on the analysis of the technical indicators, the next few days' possible stock price movement for JPSV is likely to be upward. The bullish trend, positive momentum, and moderate volatility indicate a potential continuation of the current uptrend. Investors may consider buying or holding positions in anticipation of further price appreciation. However, it is essential to monitor the indicators closely for any signs of reversal or increased selling pressure.