Technical Analysis of JPUS 2024-05-10
Overview:
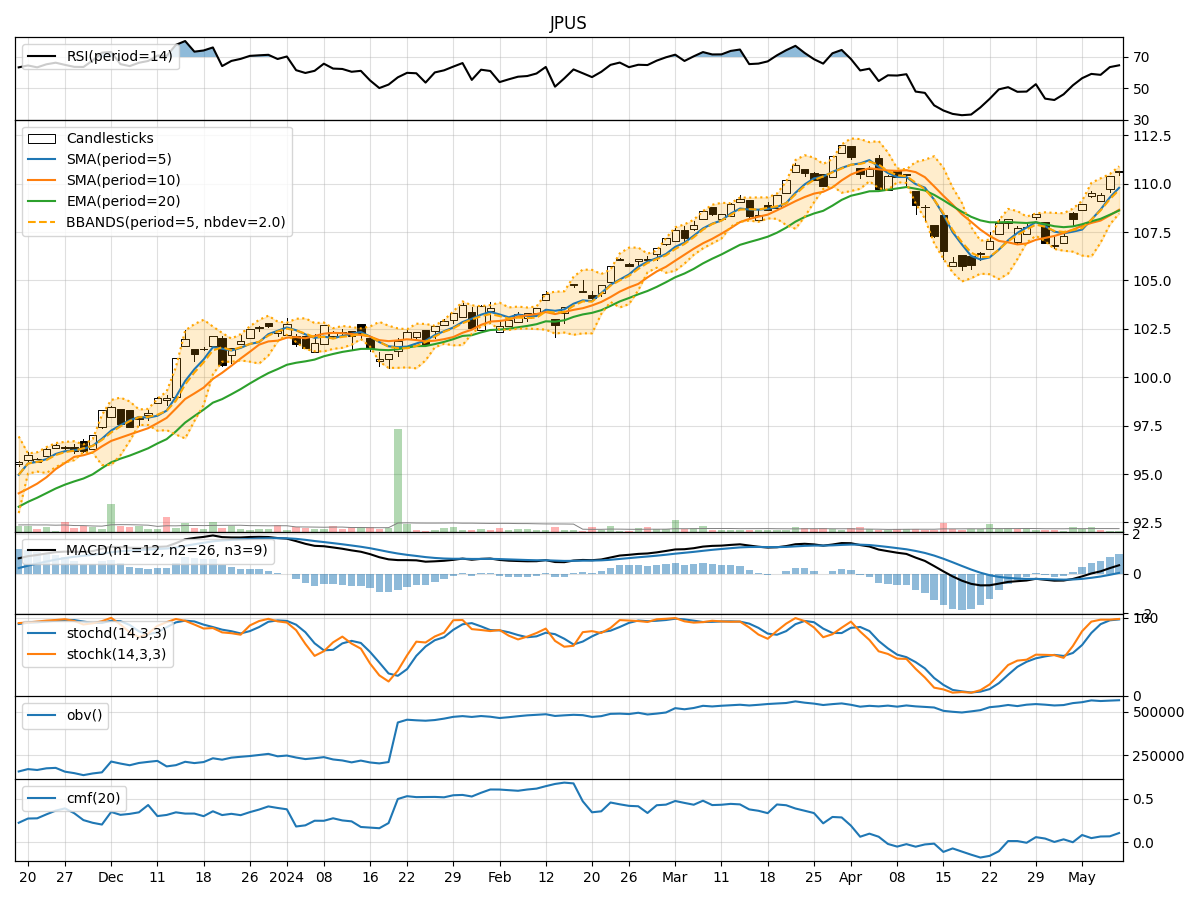
In analyzing the technical indicators for JPUS stock over the last 5 days, we will delve into the trend, momentum, volatility, and volume indicators to provide a comprehensive outlook on the possible stock price movement in the coming days. By examining these key indicators, we aim to offer valuable insights and recommendations for potential investors.
Trend Indicators:
- Moving Averages (MA): The 5-day moving average has been consistently above the simple moving average (SMA) and exponential moving average (EMA), indicating a bullish trend.
- MACD: The MACD line has been above the signal line for the past 5 days, with the MACD histogram showing an increasing trend, suggesting bullish momentum.
Momentum Indicators:
- RSI: The Relative Strength Index (RSI) has been trending upwards, indicating increasing buying pressure.
- Stochastic Oscillator: Both %K and %D have been in the overbought zone, suggesting a strong bullish momentum.
- Williams %R: The Williams %R is consistently in the oversold territory, indicating a potential reversal in the short term.
Volatility Indicators:
- Bollinger Bands: The stock price has been trading within the upper Bollinger Band, indicating an overbought condition.
- Bollinger %B: The %B indicator is above 0.8, suggesting a potential reversal or correction in the price.
Volume Indicators:
- On-Balance Volume (OBV): The OBV has been trending upwards, indicating accumulation by investors.
- Chaikin Money Flow (CMF): The CMF is positive, suggesting that money is flowing into the stock.
Key Observations:
- The trend indicators show a strong bullish sentiment with moving averages and MACD supporting an upward trend.
- Momentum indicators like RSI and Stochastic Oscillator indicate strong buying pressure and bullish momentum.
- Volatility indicators suggest a potential overbought condition, signaling a possible correction or consolidation.
- Volume indicators reflect positive accumulation and money flow into the stock.
Conclusion:
Based on the analysis of the technical indicators, the next few days for JPUS stock are likely to see continued upward movement. The bullish trend supported by moving averages and MACD, along with strong momentum and positive volume indicators, indicate a favorable outlook for the stock price. However, caution should be exercised due to the overbought condition highlighted by volatility indicators, which may lead to a short-term correction. Overall, the bias remains bullish with potential for further upside in the coming days.