Technical Analysis of JQUA 2024-05-10
Overview:
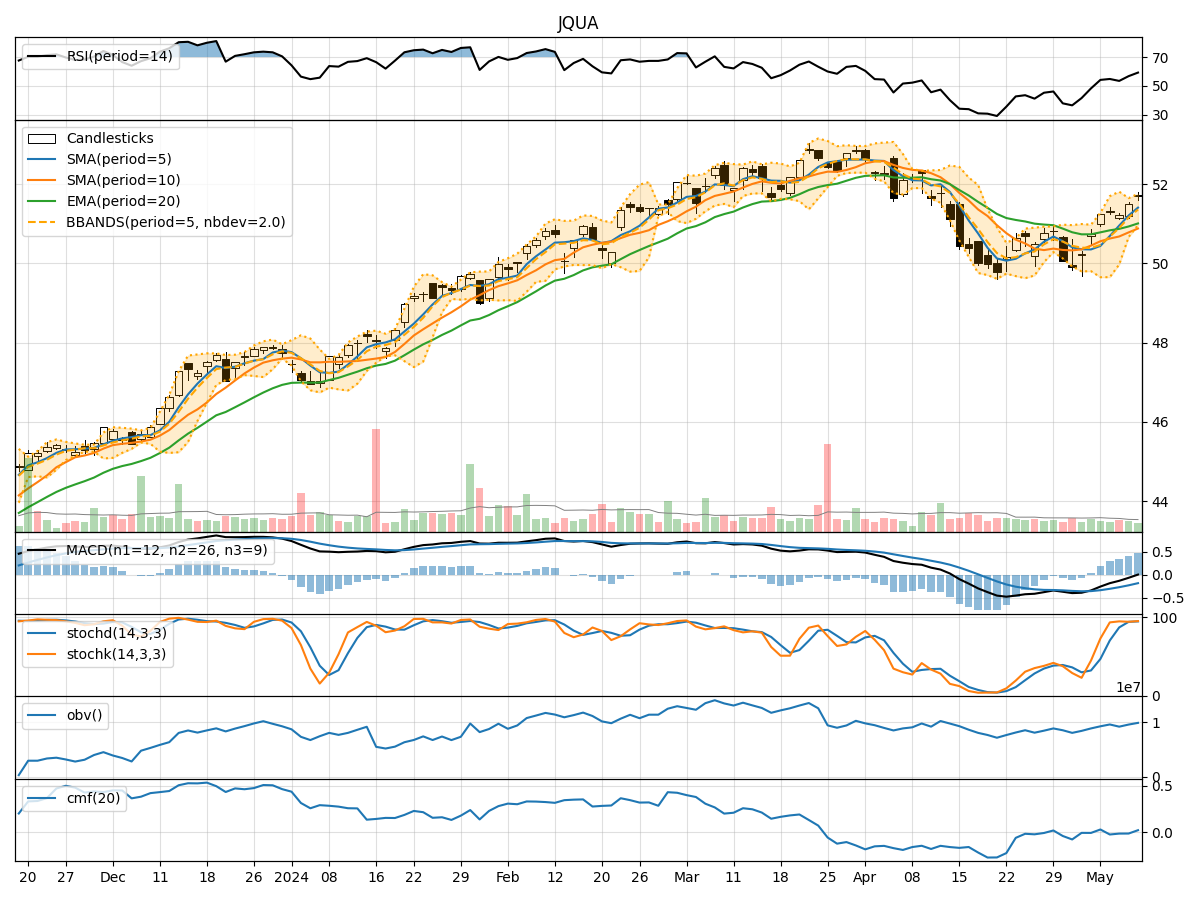
In analyzing the technical indicators for JQUA over the last 5 days, we will delve into the trends, momentum, volatility, and volume aspects to provide a comprehensive outlook on the possible stock price movement. By examining key indicators such as moving averages, MACD, RSI, Bollinger Bands, and OBV, we aim to offer valuable insights and predictions for the upcoming days.
Trend Analysis:
- Moving Averages (MA): The 5-day MA has been consistently above the closing prices, indicating a short-term uptrend.
- MACD: The MACD line has been gradually increasing, with the MACD histogram showing positive values, suggesting bullish momentum.
Momentum Analysis:
- RSI: The RSI has been trending upwards, reaching overbought levels, indicating strong buying pressure.
- Stochastic Oscillator: Both %K and %D have been in the overbought zone, signaling a potential reversal or consolidation.
Volatility Analysis:
- Bollinger Bands (BB): The stock price has been trading within the bands, with the bands narrowing, suggesting a period of low volatility.
Volume Analysis:
- On-Balance Volume (OBV): The OBV has been fluctuating but overall showing a slight decrease, indicating some distribution.
- Chaikin Money Flow (CMF): The CMF has been negative, reflecting selling pressure in the market.
Key Observations:
- The stock is in an upward trend based on moving averages and MACD.
- Momentum indicators like RSI and Stochastic Oscillator suggest the stock is overbought and may face a potential reversal.
- Volatility is decreasing, indicating a possible period of consolidation.
- Volume indicators show some distribution and selling pressure.
Conclusion:
Based on the analysis of technical indicators, the next few days for JQUA could see a potential pullback or consolidation as the stock is overbought and facing selling pressure. Traders should be cautious of a possible reversal in the short term. It is advisable to wait for clearer signals or confirmation of a new trend direction before making significant trading decisions.