Technical Analysis of JSML 2024-05-10
Overview:
In analyzing the technical indicators for JSML over the last 5 days, we will delve into the trend, momentum, volatility, and volume indicators to provide a comprehensive outlook on the possible stock price movement in the coming days. By examining these key aspects, we aim to offer valuable insights and predictions to guide your investment decisions.
Trend Analysis:
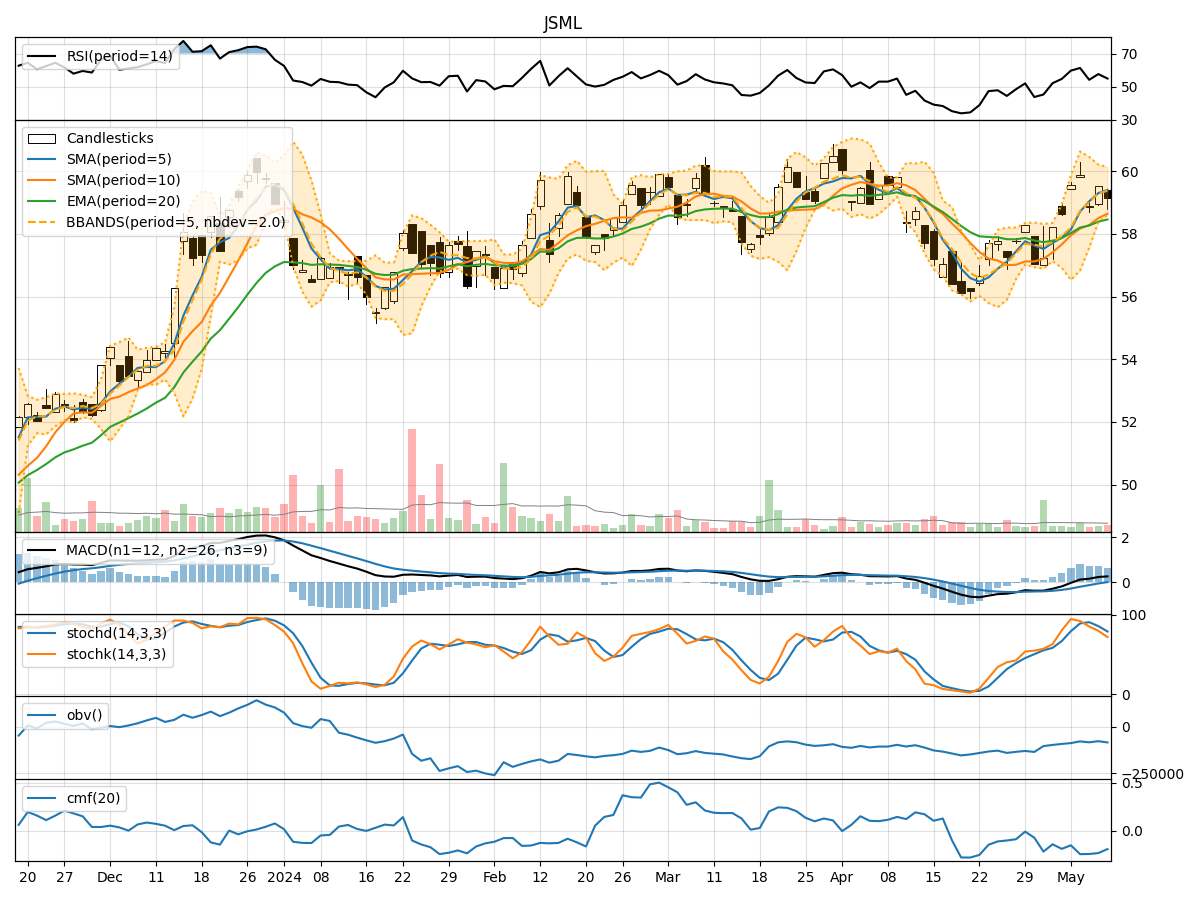
- Moving Averages (MA): The 5-day MA has been consistently above the closing prices, indicating a bullish trend.
- MACD: The MACD line has been positive and above the signal line, suggesting bullish momentum.
- EMA: The EMA has been trending upwards, supporting the bullish sentiment.
Momentum Analysis:
- RSI: The RSI values have been relatively high, indicating overbought conditions.
- Stochastic Oscillator: Both %K and %D have been decreasing, signaling a potential reversal.
- Williams %R: The indicator has been in the oversold territory, hinting at a possible upward movement.
Volatility Analysis:
- Bollinger Bands: The price has been trading within the bands, showing moderate volatility.
- Bollinger %B: The %B indicator has been fluctuating around the midline, suggesting a balanced market sentiment.
Volume Analysis:
- On-Balance Volume (OBV): The OBV has been fluctuating, indicating indecision among investors.
- Chaikin Money Flow (CMF): The CMF has been negative, reflecting selling pressure in the stock.
Key Observations:
- The trend indicators point towards a bullish sentiment in the short term.
- Momentum indicators suggest a potential reversal or consolidation phase.
- Volatility remains moderate, with no extreme price movements expected.
- Volume indicators show mixed signals, reflecting uncertainty in market participation.
Conclusion:
Based on the analysis of the technical indicators, the stock price of JSML is likely to experience further upward movement in the coming days, supported by the bullish trend and positive momentum. However, caution is advised as the momentum indicators hint at a possible reversal, and the volume indicators show mixed signals. Traders should closely monitor key support and resistance levels to navigate potential price fluctuations.