Technical Analysis of JSTC 2024-05-10
Overview:
In analyzing the technical indicators for JSTC over the last 5 days, we will delve into the trend, momentum, volatility, and volume indicators to provide a comprehensive outlook on the possible stock price movement. By examining these key factors, we aim to offer valuable insights and predictions for the upcoming trading days.
Trend Analysis:
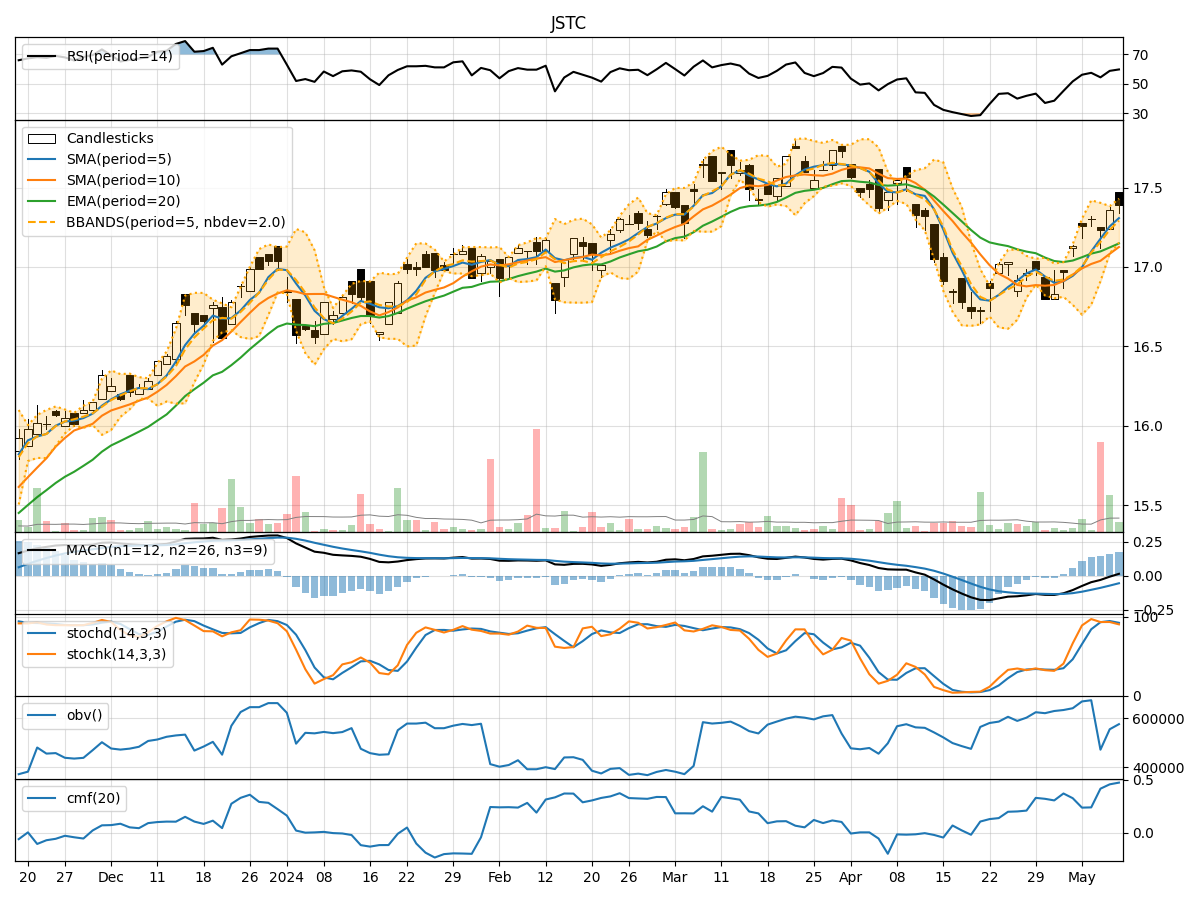
- Moving Averages (MA): The moving averages show a consistent uptrend with the closing prices above the short-term (5-day) and medium-term (10-day) moving averages. This indicates a positive trend in the stock price.
- MACD: The MACD line has been consistently above the signal line, suggesting bullish momentum in the stock.
- EMA: The exponential moving average (EMA) also indicates an upward trend in the stock price.
Momentum Analysis:
- RSI: The Relative Strength Index (RSI) is in the neutral zone, indicating potential for both upward and downward movements.
- Stochastic Oscillator: The stochastic indicators are in the overbought region, suggesting a possible reversal or consolidation in the stock price.
- Williams %R: The Williams %R is also in the overbought territory, signaling a potential pullback.
Volatility Analysis:
- Bollinger Bands: The Bollinger Bands are narrowing, indicating decreasing volatility in the stock price. This could precede a period of consolidation or a breakout.
- Bollinger %B: The %B indicator is above 0.8, suggesting that the stock is trading near the upper band, potentially indicating an overbought condition.
Volume Analysis:
- On-Balance Volume (OBV): The OBV has shown mixed movements over the past few days, indicating indecision among investors.
- Chaikin Money Flow (CMF): The CMF is positive, suggesting that money is flowing into the stock. However, the rate of inflow may be slowing down.
Conclusion:
Based on the analysis of the technical indicators, the stock of JSTC is currently in a bullish phase, supported by the positive trend indicators such as moving averages and MACD. However, the momentum indicators like RSI and stochastic oscillators suggest a potential for a short-term pullback due to overbought conditions. The narrowing Bollinger Bands indicate decreasing volatility, which could lead to a period of consolidation before a potential breakout.
In the next few days, we may see a temporary pullback in the stock price followed by a resumption of the uptrend based on the overall bullish trend. Investors should monitor the momentum indicators closely for signs of a reversal and consider potential entry points during consolidation phases. It is essential to set stop-loss levels to manage risk effectively in case of unexpected price movements.