Technical Analysis of JTEK 2024-05-10
Overview:
In analyzing the technical indicators for JTEK over the last 5 days, we will delve into the trend, momentum, volatility, and volume indicators to provide a comprehensive outlook on the possible stock price movement. By examining these key aspects, we aim to offer valuable insights and recommendations for potential future price action.
Trend Indicators:
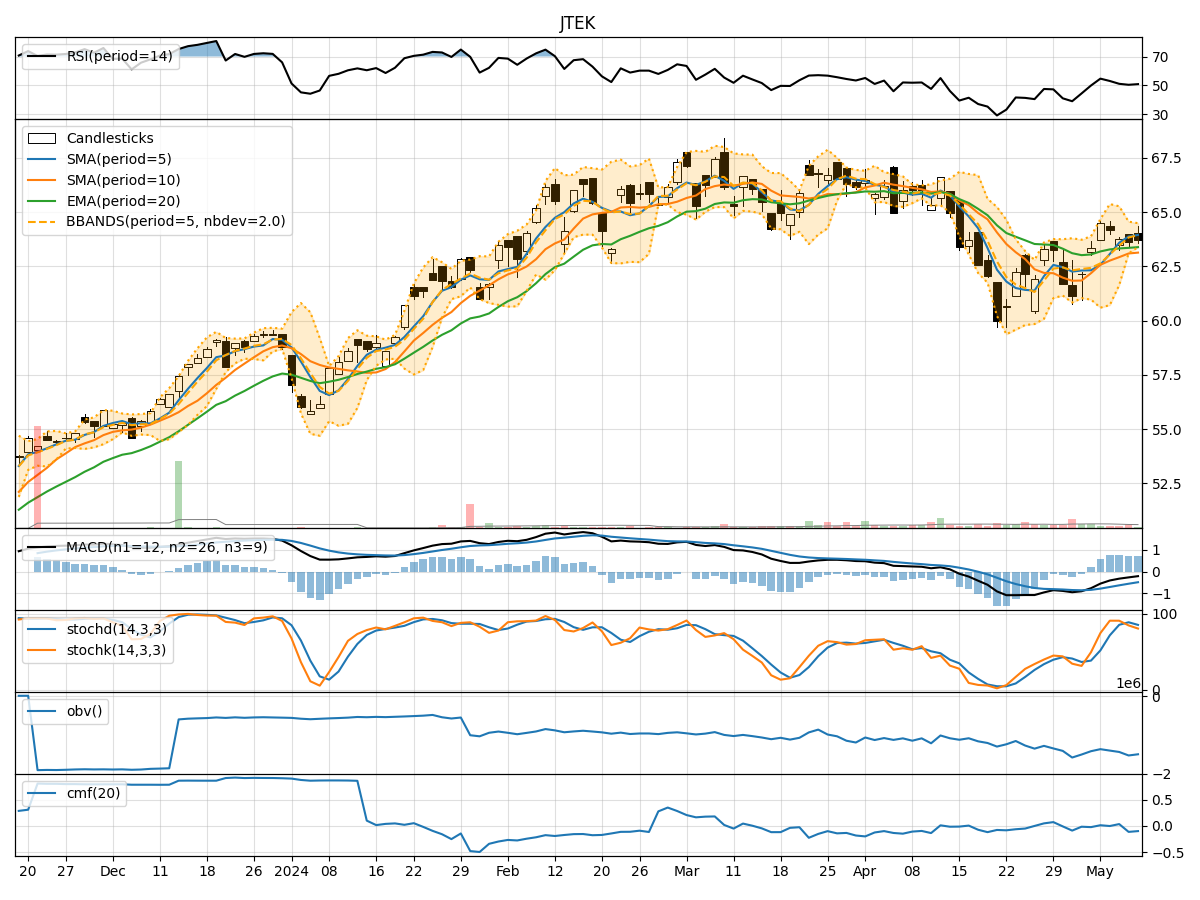
- Moving Averages (MA): The 5-day MA has been consistently above the closing prices, indicating a short-term uptrend.
- MACD: The MACD line has been below the signal line but trending upwards, suggesting a potential bullish crossover.
- RSI: The RSI has been fluctuating around the 50 level, indicating a neutral stance in terms of momentum.
Momentum Indicators:
- Stochastic Oscillator: The Stochastic indicators have been in overbought territory, signaling a potential reversal or consolidation.
- Williams %R (WillR): The WillR has been in oversold territory, suggesting a possible bounce in the stock price.
Volatility Indicators:
- Bollinger Bands (BB): The stock price has been trading within the Bollinger Bands, with the bands narrowing, indicating reduced volatility.
- Average True Range (ATR): ATR has been decreasing, reflecting diminishing price fluctuations.
Volume Indicators:
- On-Balance Volume (OBV): The OBV has been declining, indicating selling pressure in the stock.
- Chaikin Money Flow (CMF): The CMF has been negative, suggesting outflows from the stock.
Key Observations:
- The trend indicators show a potential bullish crossover in the MACD, supported by the MA indicating an uptrend.
- Momentum indicators suggest a mixed signal with Stochastic in overbought territory and WillR in oversold territory.
- Volatility indicators point towards reduced price fluctuations and a possible period of consolidation.
- Volume indicators reflect selling pressure and negative money flow, indicating bearish sentiment.
Conclusion:
Based on the analysis of the technical indicators, the next few days' possible stock price movement for JTEK is likely to experience a period of consolidation with a slight upward bias. The bullish crossover in the MACD and the uptrend indicated by the MA may support a modest price increase. However, the mixed signals from momentum indicators and the negative volume indicators suggest a cautious approach. Traders should watch for confirmation of a sustained uptrend before considering long positions.