Technical Analysis of JUCY 2024-05-10
Overview:
In analyzing the technical indicators for JUCY stock over the last 5 days, we will delve into the trend, momentum, volatility, and volume indicators to provide a comprehensive outlook on the possible stock price movement in the coming days. By examining these key indicators, we aim to offer valuable insights and predictions to guide your investment decisions.
Trend Analysis:
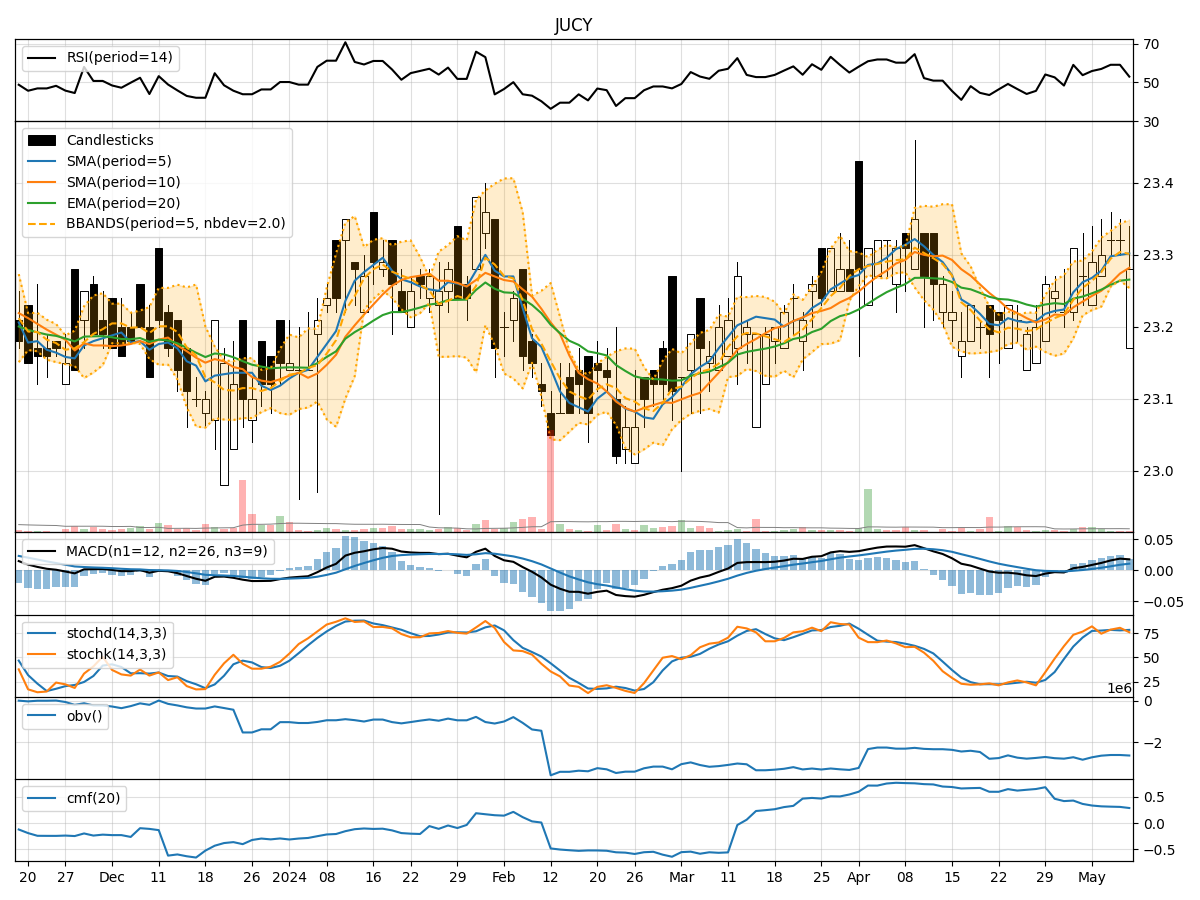
- Moving Averages (MA): The 5-day MA has been consistently above the 10-day SMA, indicating a short-term bullish trend. The EMA(20) has shown a slight upward trajectory, suggesting a positive momentum in the stock price.
- MACD: The MACD line has been above the signal line for the past 5 days, reflecting a bullish trend in the stock.
- Conclusion: The trend indicators suggest an upward momentum in the stock price.
Momentum Analysis:
- RSI: The RSI(14) has been fluctuating around the 50 level, indicating a neutral momentum in the stock.
- Stochastic Oscillator: Both %K and %D have been hovering around the overbought territory, suggesting a potential reversal in the stock price.
- Conclusion: The momentum indicators signal a neutral to slightly bearish sentiment in the stock.
Volatility Analysis:
- Bollinger Bands (BB): The stock price has been trading within the bands, with the %B indicator showing a mix of upper and lower band penetrations.
- Conclusion: The volatility indicators imply a sideways movement in the stock price.
Volume Analysis:
- On-Balance Volume (OBV): The OBV has been declining over the past 5 days, indicating a decrease in buying pressure.
- Chaikin Money Flow (CMF): The CMF(20) has also shown a downward trend, suggesting a weakening buying momentum.
- Conclusion: The volume indicators point towards a bearish sentiment in the stock.
Overall Conclusion:
Based on the analysis of trend, momentum, volatility, and volume indicators, the next few days' possible stock price movement for JUCY is likely to be sideways to slightly bearish. While the trend indicators suggest an upward momentum, the momentum and volume indicators indicate a neutral to bearish sentiment in the stock. The volatility indicators further support a sideways movement. Therefore, investors should exercise caution and consider potential downside risks in their trading decisions.
Recommendation:
Given the mixed signals from the technical indicators, it is advisable to closely monitor the stock price movement and wait for more clarity before making significant investment decisions. Consider setting stop-loss orders to manage risk effectively in case of unexpected price fluctuations. Conducting further research and staying updated on market developments will also be crucial in navigating the dynamic stock market environment.