Technical Analysis of JULH 2024-05-10
Overview:
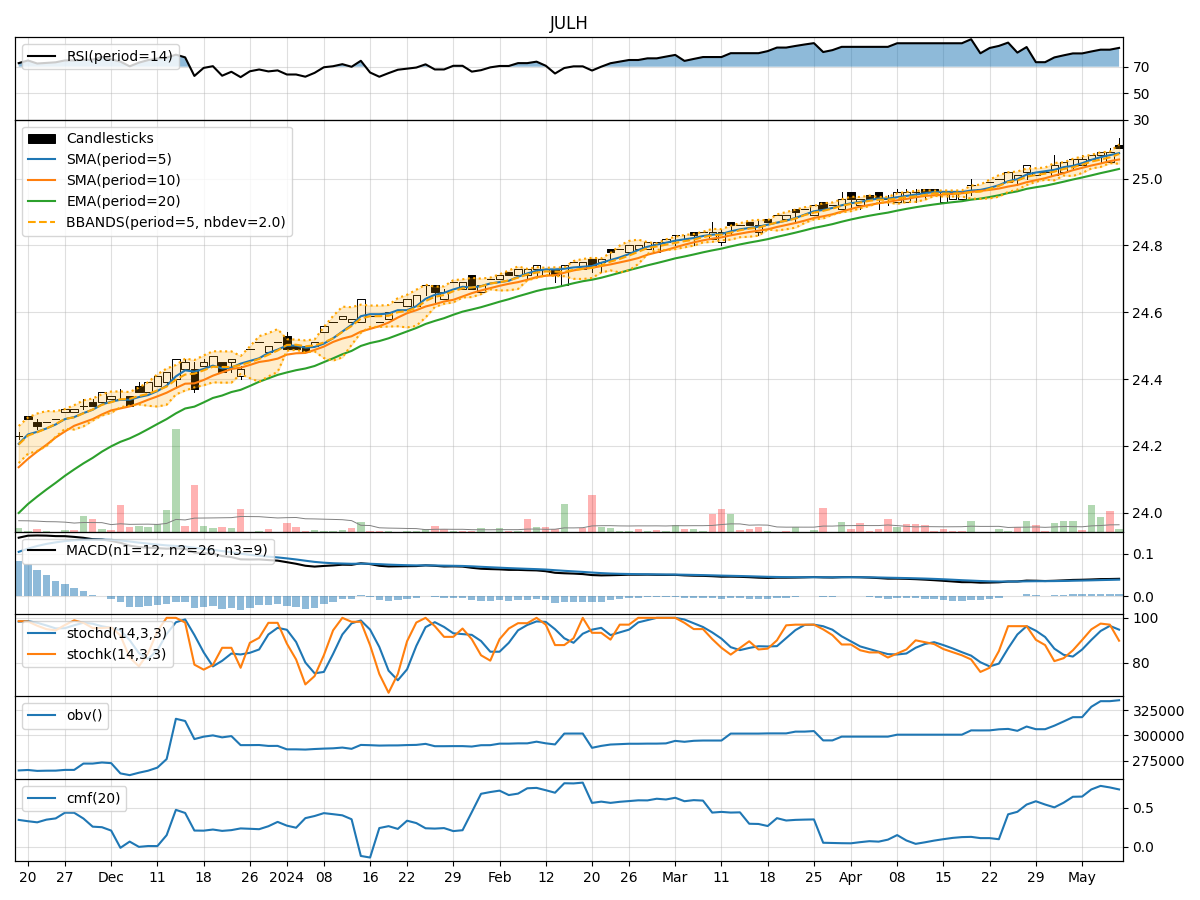
In the last 5 trading days, the stock price of JULH has shown a slight upward trend with increasing volume. The moving averages have been rising steadily, and the MACD indicator has been positive. Momentum indicators like RSI and Stochastic oscillators suggest the stock is in overbought territory. Volatility indicators show that the Bollinger Bands are widening, indicating increased price volatility. Volume indicators like OBV and CMF are positive, reflecting strong buying pressure.
Trend Analysis:
- Moving Averages (MA): The 5-day MA has been consistently above the 10-day SMA, indicating a short-term bullish trend. Both are above the 20-day EMA, further supporting the bullish sentiment.
- MACD: The MACD line has been above the signal line, indicating a positive momentum in the stock price.
Momentum Analysis:
- RSI: The RSI is in the overbought zone, suggesting that the stock may be due for a pullback or consolidation.
- Stochastic Oscillators: Both %K and %D are in the overbought region, indicating a potential reversal or correction.
Volatility Analysis:
- Bollinger Bands (BB): The widening of the Bollinger Bands suggests increasing volatility in the stock price.
Volume Analysis:
- On-Balance Volume (OBV): The OBV has been steadily increasing, indicating strong buying pressure.
- Chaikin Money Flow (CMF): The CMF is positive, reflecting accumulation of the stock.
Key Observations:
- The stock is currently in overbought territory based on momentum indicators like RSI and Stochastic oscillators.
- The positive trend in moving averages and MACD suggests a bullish sentiment in the short term.
- Increasing volatility as indicated by widening Bollinger Bands may lead to larger price swings.
- Strong buying pressure shown by OBV and CMF indicates investor confidence in the stock.
Conclusion:
Based on the technical indicators and analysis: - Short-Term: The stock may experience a slight pullback or consolidation in the next few days due to overbought conditions indicated by RSI and Stochastic oscillators. - Medium-Long Term: The overall trend remains bullish, supported by moving averages and MACD. Therefore, the stock is likely to resume its upward trajectory after a short-term correction.
Recommendation:
- Short-Term Traders: Consider taking profits or waiting for a better entry point during the potential pullback.
- Long-Term Investors: Hold onto the stock as the overall trend remains bullish, and use any dips as buying opportunities.
Key Words:
- Short-Term: Pullback/Consolidation
- Medium-Long Term: Bullish/Uptrend