Technical Analysis of JULJ 2024-05-10
Overview:
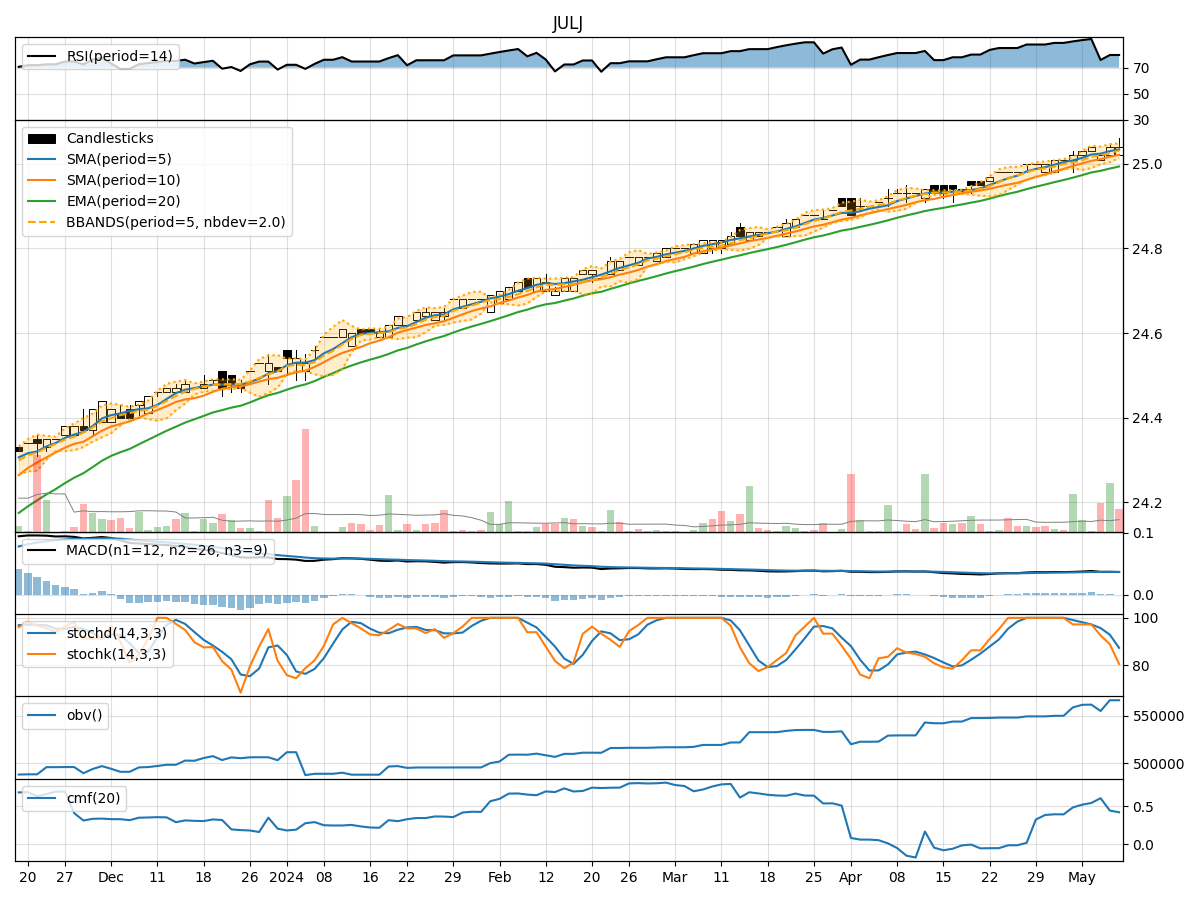
In analyzing the technical indicators for JULJ stock over the last 5 days, we will delve into the trend, momentum, volatility, and volume indicators to provide a comprehensive outlook on the possible stock price movement in the upcoming days. By examining these key indicators, we aim to offer valuable insights and predictions for potential investors.
Trend Indicators:
- Moving Averages (MA): The moving averages show a consistent uptrend with the closing prices above the short-term (5-day) and medium-term (10-day) moving averages. This indicates a positive trend in the stock price.
- MACD: The MACD line has been fluctuating around the signal line, suggesting a neutral momentum in the stock price movement.
- EMA: The exponential moving average has been steadily increasing, supporting the bullish trend in the stock.
Momentum Indicators:
- RSI: The Relative Strength Index (RSI) is in the overbought territory, indicating a strong bullish momentum in the stock.
- Stochastic Oscillator: Both %K and %D lines of the Stochastic Oscillator are in the overbought zone, signaling a potential reversal or consolidation in the stock price.
- Williams %R: The Williams %R is also in the overbought region, suggesting a possible pullback in the stock price.
Volatility Indicators:
- Bollinger Bands: The Bollinger Bands are narrowing, indicating decreasing volatility in the stock price. This could precede a period of consolidation or a breakout.
- Bollinger %B: The %B indicator is hovering around the middle range, suggesting a balanced market sentiment.
Volume Indicators:
- On-Balance Volume (OBV): The OBV indicator has been relatively stable, indicating a consistent buying pressure in the stock.
- Chaikin Money Flow (CMF): The CMF is positive but has shown some fluctuations, reflecting mixed sentiment among investors.
Conclusion:
Based on the analysis of the technical indicators, the stock is currently in an overbought state with strong bullish momentum. However, the Stochastic Oscillator and Williams %R suggest a potential reversal or consolidation in the near term. The narrowing Bollinger Bands also indicate reduced volatility, which could lead to a period of sideways movement.
Recommendation:
Considering the mixed signals from the indicators, it is advisable to exercise caution in entering new positions at the current price levels. Traders may consider taking profits on existing positions or implementing risk management strategies to navigate potential price fluctuations. Monitoring the Stochastic Oscillator and Williams %R for signs of a reversal would be crucial in determining the next directional move in the stock price.