Technical Analysis of JULQ 2024-05-10
Overview:
In analyzing the technical indicators for JULQ stock over the last 5 days, we will delve into the trend, momentum, volatility, and volume indicators to provide a comprehensive outlook on the possible stock price movement in the coming days. By examining these key indicators, we aim to offer valuable insights and predictions for potential investors or traders.
Trend Indicators:
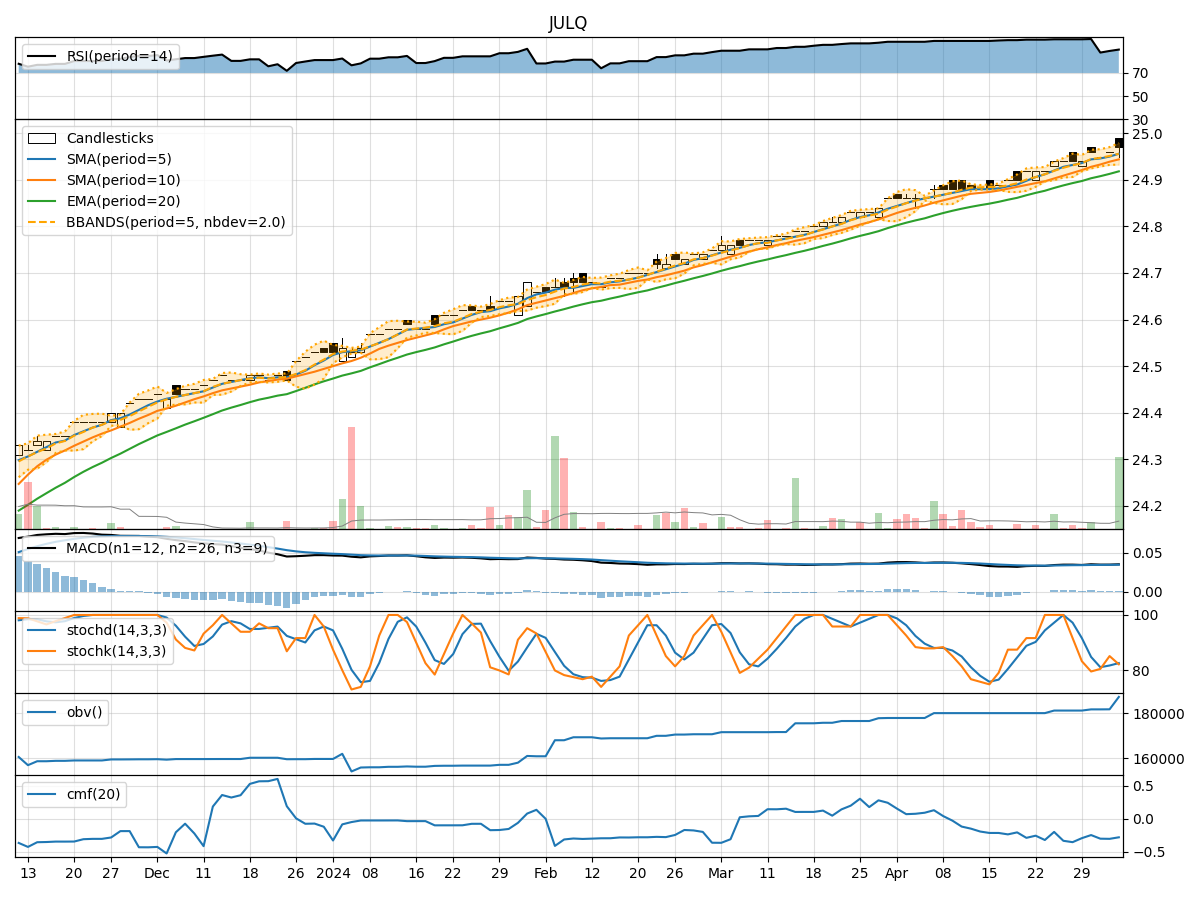
- Moving Averages (MA): The 5-day Moving Average (MA) has been relatively stable around the closing price, indicating a lack of significant directional movement.
- MACD: The Moving Average Convergence Divergence (MACD) has shown a slight positive trend, with the MACD line consistently above the signal line.
- RSI: The Relative Strength Index (RSI) is high at 91.37, suggesting the stock may be overbought.
Momentum Indicators:
- Stochastic Oscillator: The Stochastic Oscillator indicates that the stock is in the overbought territory, potentially signaling a reversal.
- Williams %R: The Williams %R is also in the oversold region, further supporting a potential reversal.
Volatility Indicators:
- Bollinger Bands: The Bollinger Bands have narrowed, indicating decreased volatility and a possible period of consolidation.
- BB% (Bollinger Band %B): The BB% is close to 1, suggesting the stock price is at the upper band, potentially indicating an overbought condition.
Volume Indicators:
- On-Balance Volume (OBV): The OBV has remained constant, indicating a lack of significant buying or selling pressure.
- Chaikin Money Flow (CMF): The CMF is negative, suggesting a bearish sentiment in the market.
Key Observations and Opinions:
- Trend: The trend indicators show a lack of clear direction in the stock price, with a slight positive bias in the MACD.
- Momentum: Both the Stochastic Oscillator and Williams %R indicate potential overbought conditions, signaling a possible reversal in the stock price.
- Volatility: The narrowing Bollinger Bands and high BB% suggest a period of consolidation or a potential pullback in the stock price.
- Volume: The volume indicators do not show significant buying or selling pressure, indicating a neutral stance.
Conclusion:
Based on the analysis of the technical indicators, the stock price of JULQ is likely to experience a downward correction in the coming days. The overbought conditions indicated by the Stochastic Oscillator and Williams %R, coupled with the lack of clear trend direction and negative CMF, suggest a potential reversal in the stock price. Traders and investors should exercise caution and consider waiting for a more favorable entry point before taking any positions.