Technical Analysis of JULW 2024-05-10
Overview:
In analyzing the technical indicators for JULW stock over the last 5 days, we will delve into the trend, momentum, volatility, and volume indicators to provide a comprehensive outlook on the possible stock price movement in the upcoming days. By examining these key indicators, we aim to offer valuable insights and predictions for potential investors.
Trend Analysis:
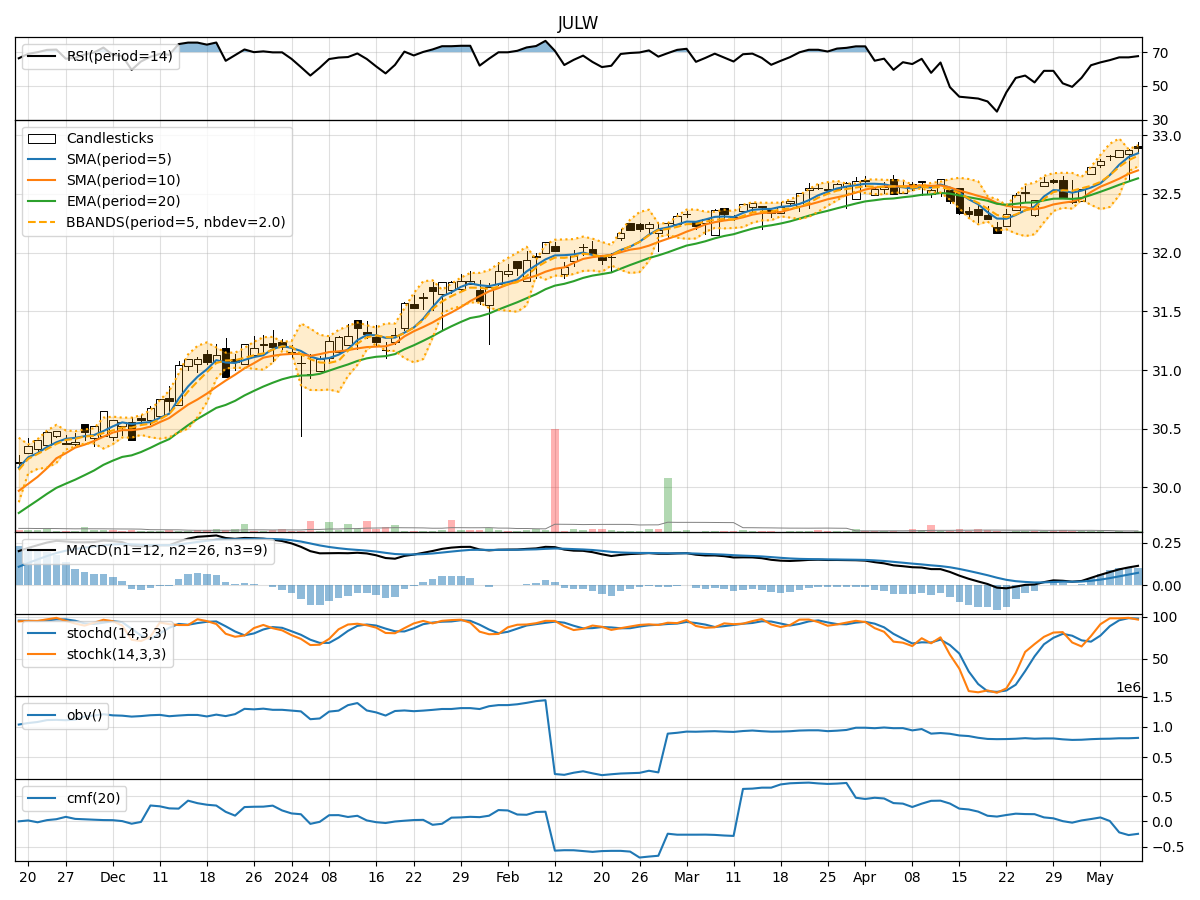
- Moving Averages (MA): The 5-day MA has been consistently above the closing prices, indicating a bullish trend.
- MACD: The MACD line has been above the signal line, suggesting a positive momentum in the stock price.
- RSI: The RSI values have been in the range of 60-70, indicating a moderate bullish sentiment.
Momentum Analysis:
- Stochastic Oscillator: The Stochastic Oscillator has been in the overbought zone, suggesting a potential reversal or consolidation.
- Williams %R: The Williams %R values have been fluctuating around oversold levels, indicating a mixed sentiment.
Volatility Analysis:
- Bollinger Bands (BB): The stock price has been trading within the Bollinger Bands, with the bands narrowing, indicating reduced volatility.
- Average True Range (ATR): The ATR values have been relatively stable, suggesting consistent price movements.
Volume Analysis:
- On-Balance Volume (OBV): The OBV values have been declining, indicating a potential distribution phase.
- Chaikin Money Flow (CMF): The CMF values have been negative, suggesting outflow of money from the stock.
Key Observations:
- The trend indicators suggest a bullish sentiment in the stock price.
- Momentum indicators show signs of potential reversal or consolidation.
- Volatility indicators point towards reduced price fluctuations.
- Volume indicators indicate a distribution phase with outflow of money.
Conclusion:
Based on the analysis of the technical indicators, the next few days' possible stock price movement for JULW is likely to be sideways with a slight bearish bias. The bullish trend may face resistance due to overbought conditions in momentum indicators and negative volume indicators. Investors should exercise caution and consider potential consolidation or a minor pullback in the stock price.