Technical Analysis of JUNZ 2024-05-10
Overview:
In analyzing the technical indicators for JUNZ stock over the last 5 days, we will delve into the trend, momentum, volatility, and volume indicators to provide a comprehensive outlook on the possible stock price movement in the coming days. By examining these key indicators, we aim to offer valuable insights and predictions for potential investors.
Trend Analysis:
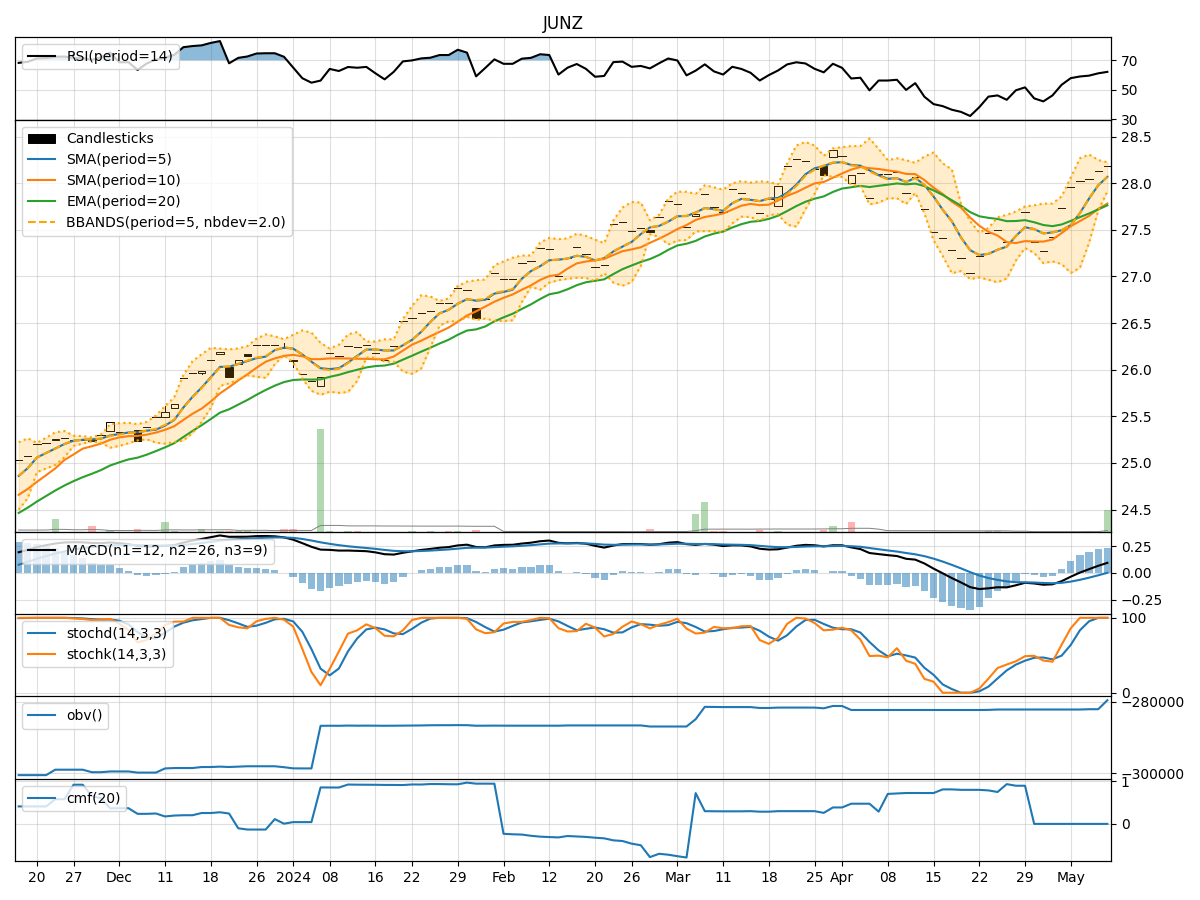
- Moving Averages (MA): The 5-day Moving Average (MA) has been consistently rising, indicating a bullish trend in the short term.
- MACD: The MACD line has been above the signal line for the past 5 days, suggesting a bullish momentum.
- RSI: The Relative Strength Index (RSI) has been increasing, showing strengthening buying pressure.
Key Observation: The trend indicators suggest a bullish sentiment in the stock price movement.
Momentum Analysis:
- Stochastic Oscillator: Both %K and %D have been at 100%, indicating strong upward momentum.
- Williams %R: The Williams %R is at 0.0, signaling an overbought condition.
Key Observation: Momentum indicators reflect a strong bullish momentum in the stock.
Volatility Analysis:
- Bollinger Bands (BB): The stock price has been trading within the upper Bollinger Band, indicating high volatility.
- Bollinger Band Width: The Band Width has been narrowing, suggesting a potential decrease in volatility.
Key Observation: Volatility indicators show high volatility but with a possibility of a decrease in the near future.
Volume Analysis:
- On-Balance Volume (OBV): The OBV has been increasing, indicating accumulation by investors.
- Chaikin Money Flow (CMF): The CMF has been at 0.0, suggesting a neutral money flow trend.
Key Observation: Volume indicators point towards increasing buying interest in the stock.
Conclusion:
Based on the analysis of the technical indicators, the next few days' possible stock price movement for JUNZ is bullish. The trend indicators, momentum indicators, and volume indicators all align in signaling a bullish sentiment. However, the high volatility indicated by the Bollinger Bands suggests that there may be some fluctuations in the price movement. Investors should consider entering long positions with caution, keeping an eye on the evolving market dynamics.
In summary, the technical analysis indicates a bullish outlook for JUNZ stock in the coming days, supported by strong trends, momentum, and volume. It is essential for investors to monitor the price action closely and adjust their strategies accordingly to capitalize on potential opportunities in the market.