Technical Analysis of JVAL 2024-05-10
Overview:
In analyzing the technical indicators for JVAL stock over the last 5 days, we will delve into the trend, momentum, volatility, and volume indicators to provide a comprehensive outlook on the possible future stock price movement. By examining these key indicators, we aim to offer valuable insights and predictions for the upcoming trading days.
Trend Analysis:
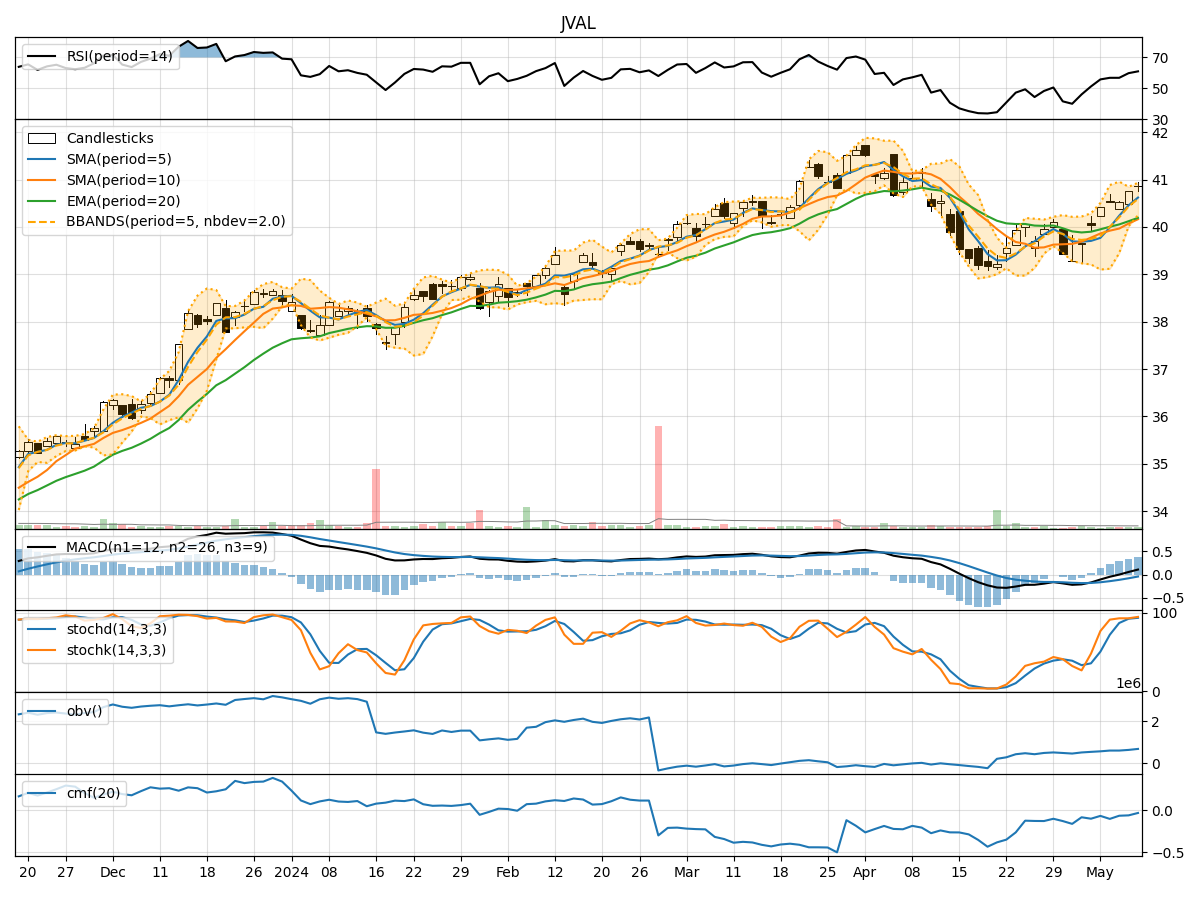
- Moving Averages (MA): The 5-day Moving Average (MA) has been consistently above the Simple Moving Average (SMA) and Exponential Moving Average (EMA), indicating a bullish trend.
- MACD: The MACD line has been consistently above the signal line, with the MACD Histogram showing an increasing positive trend, suggesting bullish momentum.
Momentum Analysis:
- RSI: The Relative Strength Index (RSI) has been trending upwards, indicating increasing buying pressure and potential overbought conditions.
- Stochastic Oscillator: Both %K and %D have been in the overbought zone, suggesting a potential reversal or consolidation phase.
- Williams %R: The Williams %R is in the oversold territory, indicating a potential buying opportunity.
Volatility Analysis:
- Bollinger Bands (BB): The stock price has been trading within the upper Bollinger Band (BBU), suggesting an overbought condition.
- Bollinger Band Width (BBW): The BBW has been narrowing, indicating decreasing volatility and a possible period of consolidation.
Volume Analysis:
- On-Balance Volume (OBV): The OBV has been declining, suggesting selling pressure and potential bearish sentiment.
- Chaikin Money Flow (CMF): The CMF has been negative, indicating outflow of money from the stock.
Conclusion:
Based on the analysis of the technical indicators, the next few days for JVAL stock are likely to see a potential pullback or consolidation. The stock has shown signs of being overbought based on the RSI and Stochastic Oscillator readings, while the declining OBV and negative CMF indicate weakening buying interest. The narrowing Bollinger Band Width also suggests a period of reduced volatility and possible sideways movement. Therefore, it is advisable to exercise caution and consider waiting for clearer signals before making any significant trading decisions.