Technical Analysis of KALL 2024-05-10
Overview:
In analyzing the technical indicators for KALL stock over the last 5 days, we will delve into the trend, momentum, volatility, and volume indicators to provide a comprehensive outlook on the possible future stock price movement. By examining these key indicators, we aim to offer valuable insights and recommendations for potential investors.
Trend Indicators:
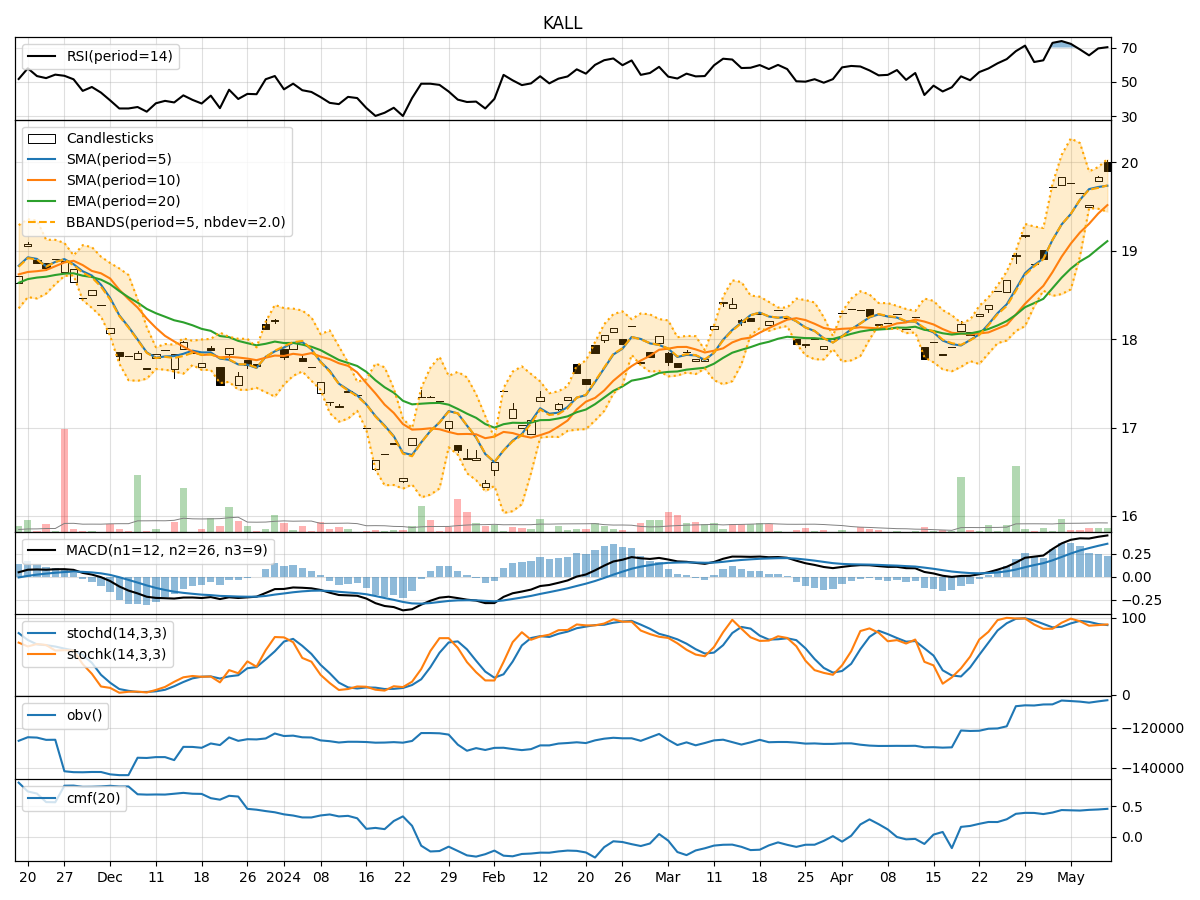
- Moving Averages (MA): The moving averages show an upward trend, with the 5-day MA consistently above the 10-day SMA and 20-day EMA. This indicates a positive momentum in the stock price.
- MACD: The MACD line has been consistently above the signal line, suggesting a bullish trend in the stock.
- MACD Histogram: The MACD histogram has been increasing over the past 5 days, indicating strengthening bullish momentum.
Momentum Indicators:
- RSI: The RSI has been fluctuating but generally staying in the overbought territory, indicating strong buying pressure.
- Stochastic Oscillator: Both %K and %D lines of the stochastic oscillator have been in the overbought zone, suggesting a potential reversal or consolidation.
- Williams %R: The Williams %R has been fluctuating but generally indicating an oversold condition.
Volatility Indicators:
- Bollinger Bands: The Bollinger Bands have been narrowing, indicating decreasing volatility in the stock price.
- Bollinger %B: The %B indicator has been hovering around 0.5, suggesting the stock is trading at the middle of the bands.
- Average True Range (ATR): The ATR has been relatively stable, indicating consistent price movement.
Volume Indicators:
- On-Balance Volume (OBV): The OBV has been showing a slight increase over the past 5 days, indicating accumulation by investors.
- Chaikin Money Flow (CMF): The CMF has been positive, indicating buying pressure in the stock.
Key Observations:
- The trend indicators suggest a bullish sentiment with moving averages and MACD signaling an upward trend.
- Momentum indicators show mixed signals with RSI in the overbought zone and stochastic oscillator hinting at a potential reversal.
- Volatility indicators point towards decreasing volatility in the stock price.
- Volume indicators indicate a slight increase in buying pressure.
Conclusion:
Based on the analysis of the technical indicators, the stock of KALL is bullish in the short term. However, there are signs of potential reversal or consolidation in momentum indicators like the stochastic oscillator. Investors should closely monitor these indicators for any shifts in market sentiment. Overall, the stock is likely to experience upward movement in the next few days, but caution is advised due to the mixed signals in momentum indicators.