Technical Analysis of KARS 2024-05-10
Overview:
In analyzing the technical indicators for KARS over the last 5 days, we will delve into the trend, momentum, volatility, and volume indicators to provide a comprehensive outlook on the possible stock price movement in the coming days. By examining these key aspects, we aim to offer valuable insights and predictions for potential investors.
Trend Analysis:
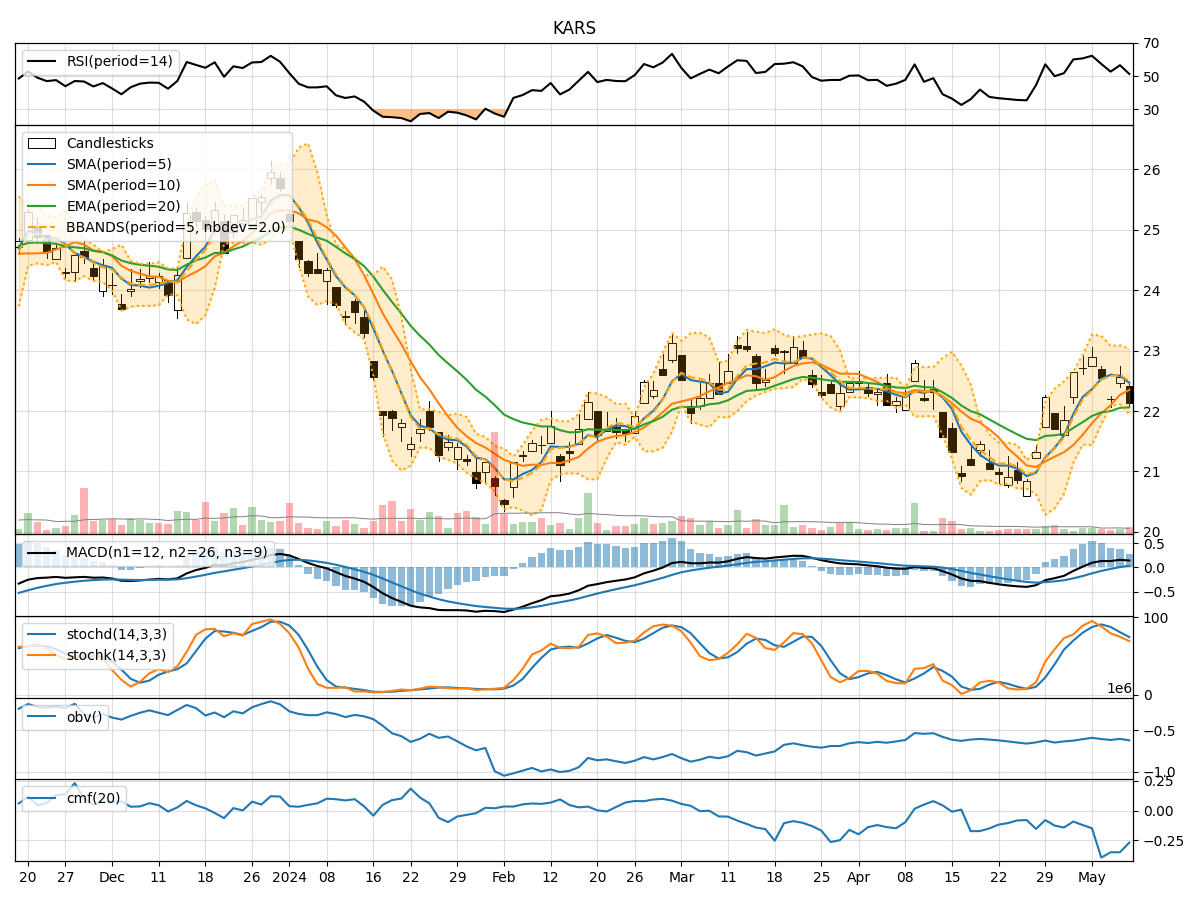
- Moving Averages (MA): The 5-day Moving Average (MA) has been fluctuating around the closing prices, indicating short-term price trends. The Simple Moving Average (SMA) and Exponential Moving Average (EMA) show a gradual increase over the period.
- MACD: The Moving Average Convergence Divergence (MACD) and its signal line (MACDH) have been positive, suggesting a bullish momentum in the stock price.
Momentum Analysis:
- RSI: The Relative Strength Index (RSI) has been oscillating around the neutral level of 50, indicating a balanced momentum in the stock.
- Stochastic Oscillator: Both %K and %D levels of the Stochastic Oscillator have been declining, signaling a potential reversal in the stock's momentum.
Volatility Analysis:
- Bollinger Bands (BB): The Bollinger Bands have been narrowing, indicating decreasing volatility in the stock price.
Volume Analysis:
- On-Balance Volume (OBV): The OBV has been fluctuating, suggesting mixed sentiment among investors regarding the stock.
- Chaikin Money Flow (CMF): The CMF has been negative, indicating a bearish money flow in the stock.
Key Observations:
- The stock has shown a mixed trend with slight bullish momentum but decreasing volatility.
- The volume indicators reflect uncertainty and lack of strong buying or selling pressure.
- The stock price has been consolidating within a narrow range, possibly indicating a period of indecision among market participants.
Conclusion:
Based on the analysis of the technical indicators, the next few days' possible stock price movement for KARS is sideways consolidation. The stock is likely to trade within a tight range with limited upside or downside potential. Investors should exercise caution and wait for clearer signals before making significant trading decisions.