Technical Analysis of KBA 2024-05-10
Overview:
In analyzing the technical indicators for KBA over the last 5 days, we will delve into the trend, momentum, volatility, and volume indicators to provide a comprehensive outlook on the possible stock price movement in the coming days. By examining these key aspects, we aim to offer valuable insights and predictions for potential investors.
Trend Analysis:
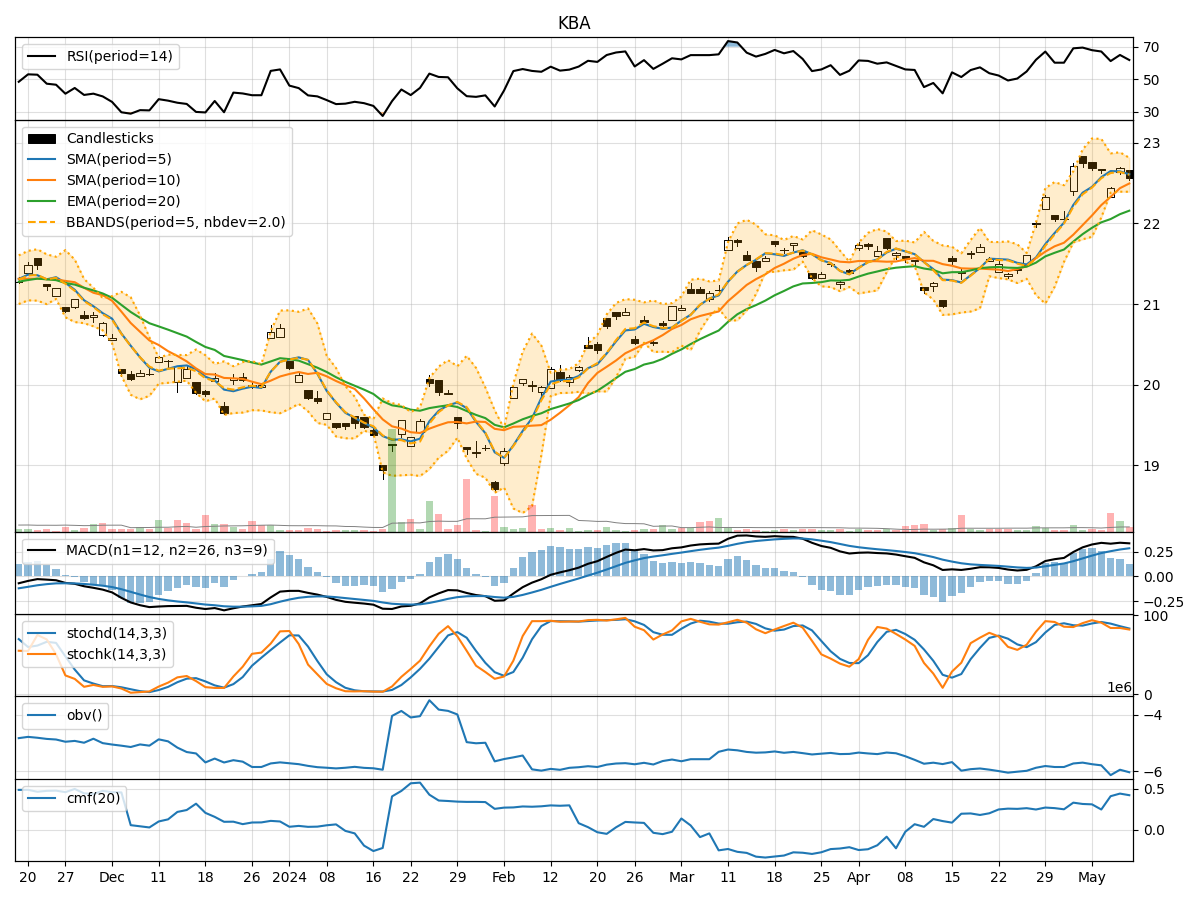
- Moving Averages (MA): The 5-day Moving Average (MA) has been fluctuating around the current stock price, indicating a neutral trend.
- MACD: The Moving Average Convergence Divergence (MACD) has shown a slight positive trend, with the MACD line consistently above the signal line.
- EMA: The Exponential Moving Average (EMA) has been gradually increasing, suggesting a bullish sentiment in the short term.
Momentum Analysis:
- RSI: The Relative Strength Index (RSI) has been oscillating within the neutral range, indicating a lack of strong momentum in either direction.
- Stochastic Oscillator: Both %K and %D have been declining, signaling a potential bearish momentum.
- Williams %R: The Williams %R is in the oversold territory, suggesting a possible reversal in the short term.
Volatility Analysis:
- Bollinger Bands: The Bollinger Bands have been narrowing, indicating decreasing volatility and a potential price breakout in the near future.
- Bollinger %B: The %B indicator is hovering around the middle range, suggesting a period of consolidation.
Volume Analysis:
- On-Balance Volume (OBV): The OBV has shown mixed signals, with no clear trend in volume accumulation or distribution.
- Chaikin Money Flow (CMF): The CMF has been positive, indicating buying pressure in the market.
Conclusion:
Based on the analysis of the technical indicators, the stock of KBA is likely to experience sideways movement in the next few days. The trend indicators suggest a neutral to slightly bullish sentiment, supported by the EMA and MACD. However, the momentum indicators point towards a potential bearish momentum, especially with the Stochastic Oscillator in the oversold region.
The volatility indicators indicate a potential breakout due to the narrowing Bollinger Bands, while the volume indicators show mixed signals with no clear trend in volume accumulation. Overall, the stock is expected to consolidate in the short term, with a possibility of a slight downward movement before a potential reversal.
Investors should closely monitor the price action and key support/resistance levels to make informed trading decisions. It is advisable to wait for confirmation of a new trend direction before entering any positions.