Technical Analysis of KDIV 2024-05-10
Overview:
In analyzing the technical indicators for KDIV stock over the last 5 days, we will delve into the trend, momentum, volatility, and volume indicators to provide a comprehensive outlook on the possible stock price movement in the coming days. By examining these key indicators, we aim to offer valuable insights and predictions for potential investors.
Trend Analysis:
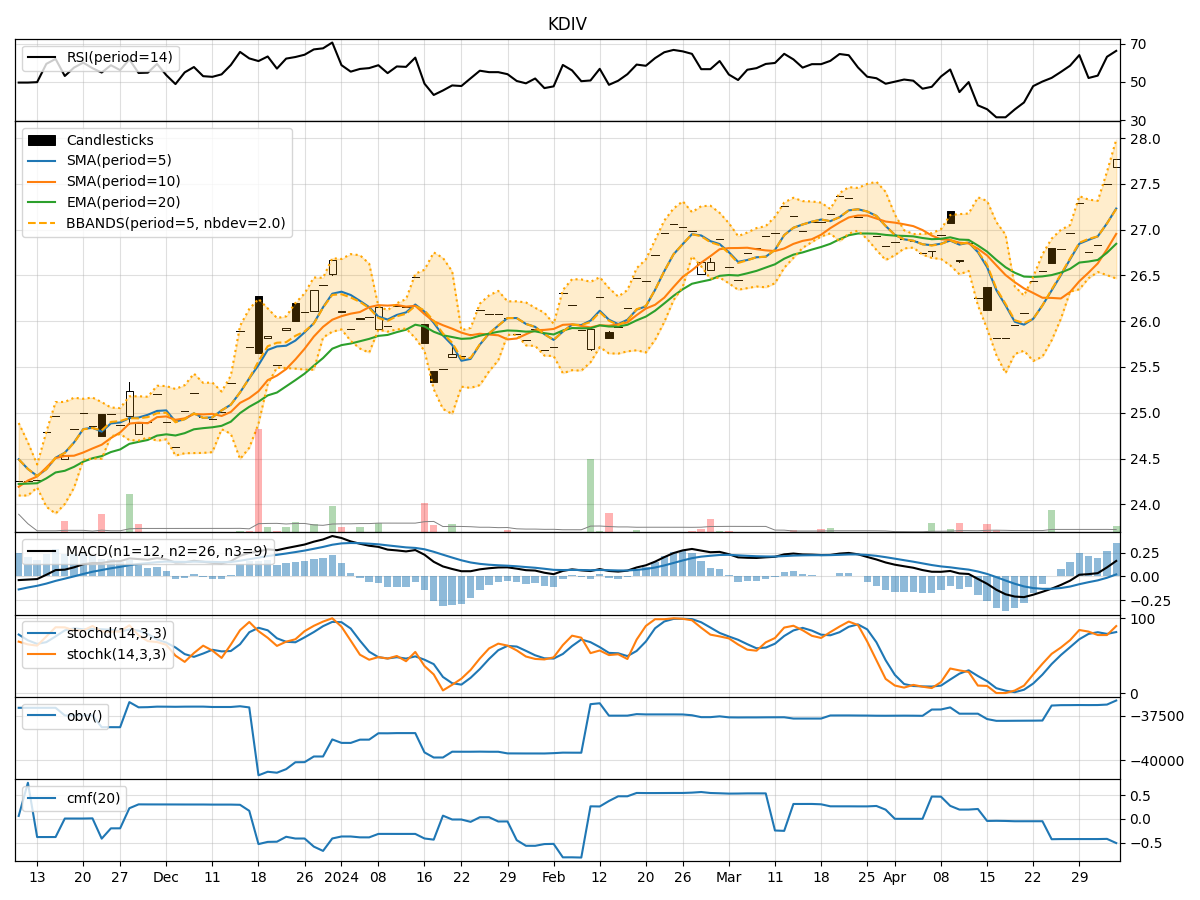
- Moving Averages (MA): The moving averages have been showing an upward trend, with the 5-day MA consistently above the longer-term SMAs and EMAs. This indicates a bullish momentum in the short term.
- MACD: The MACD line has been consistently above the signal line, with both lines showing an upward trajectory. This suggests a strengthening bullish trend.
- RSI: The RSI has been hovering in the overbought territory, indicating a strong bullish momentum in the stock.
Momentum Analysis:
- Stochastic Oscillator: The stochastic oscillator has been in the overbought zone, suggesting that the stock may be due for a pullback or consolidation in the near future.
- Williams %R: The Williams %R indicator has been consistently in the oversold territory, signaling a potential reversal or correction in the stock price.
Volatility Analysis:
- Bollinger Bands: The Bollinger Bands have been widening, indicating increased volatility in the stock price. This could lead to larger price swings in the coming days.
- Volatility Indicators: The volatility indicators show fluctuating levels, suggesting that the stock may experience periods of both high and low volatility in the near term.
Volume Analysis:
- On-Balance Volume (OBV): The OBV indicator has been relatively stable, indicating that buying and selling pressure are balanced in the stock.
- Chaikin Money Flow (CMF): The CMF has been negative, suggesting that money may be flowing out of the stock in the short term.
Conclusion:
Based on the analysis of the technical indicators, the stock of KDIV is currently exhibiting strong bullish momentum in the short term, as indicated by the moving averages, MACD, and RSI. However, the overbought readings on the stochastic oscillator and Williams %R signal a potential pullback or consolidation in the stock price. The widening Bollinger Bands and fluctuating volatility indicators also point towards increased price volatility in the coming days.
Key Points:
- Bullish Momentum: Short-term trend indicators suggest a bullish outlook.
- Potential Pullback: Overbought readings on momentum indicators indicate a possible correction.
- Increased Volatility: Widening Bollinger Bands signal higher volatility ahead.
- Balanced Volume: OBV shows balanced buying and selling pressure.
Recommendation:
Given the current technical outlook, investors should exercise caution and consider waiting for a potential pullback or consolidation before entering a position. Monitoring the stock closely for signs of a reversal or continuation of the bullish trend would be advisable. It is essential to consider risk management strategies and set clear entry and exit points based on the evolving market dynamics.