Technical Analysis of KDRN 2024-05-10
Overview:
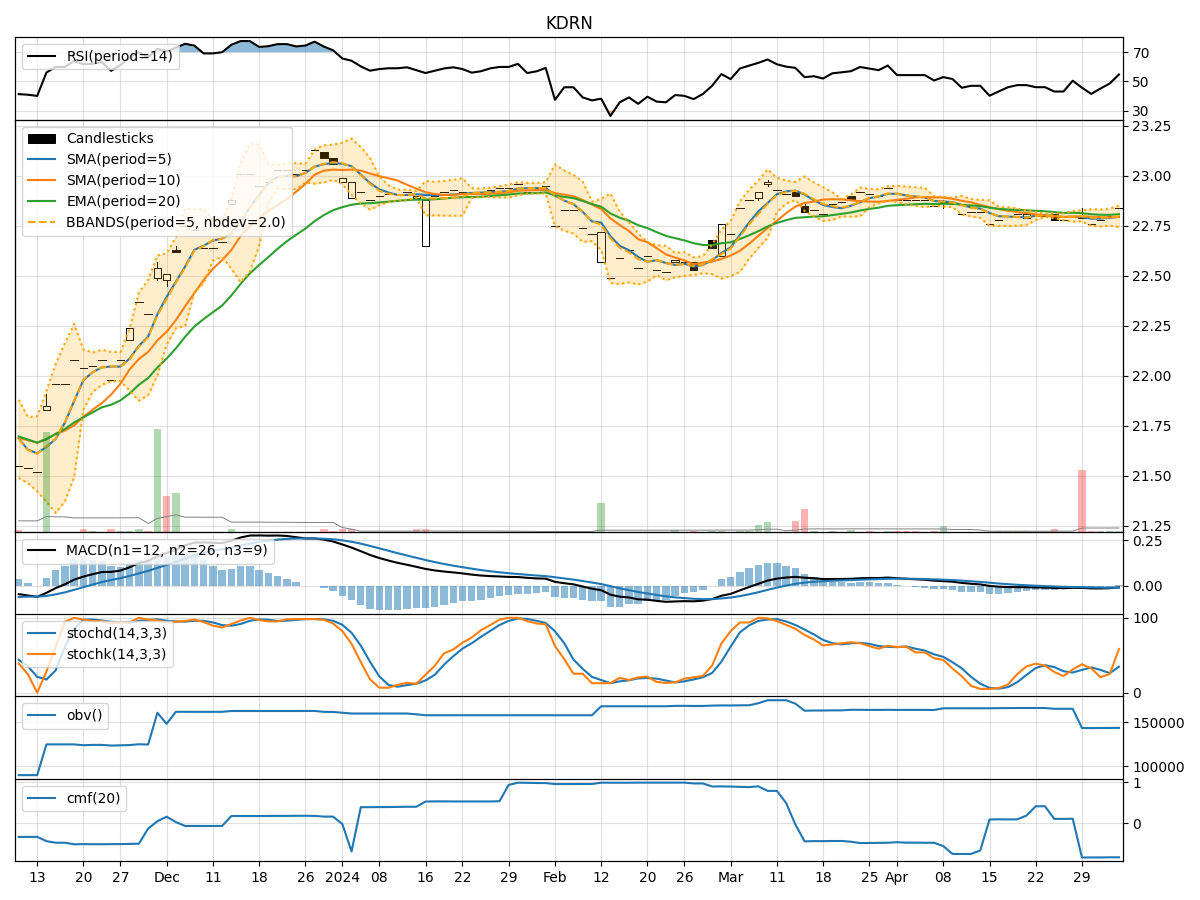
In analyzing the technical indicators for KDRN over the last 5 days, we will delve into the trend, momentum, volatility, and volume indicators to provide a comprehensive outlook on the possible stock price movement. By examining these key factors, we aim to offer valuable insights and predictions for the upcoming days.
Trend Indicators:
- Moving Averages (MA): The 5-day MA has been consistently above the closing prices, indicating a short-term uptrend.
- MACD: The MACD line has been above the signal line, suggesting bullish momentum.
- EMA: The exponential moving average has been trending upwards, supporting the bullish sentiment.
Momentum Indicators:
- RSI: The RSI has been fluctuating around the neutral zone, indicating a lack of strong momentum.
- Stochastic Oscillator: The stochastic indicators have shown mixed signals, with some divergence between %K and %D.
- Williams %R: The Williams %R has been in oversold territory, suggesting a potential reversal.
Volatility Indicators:
- Bollinger Bands: The stock price has been trading within the Bollinger Bands, indicating a period of consolidation.
- Bollinger Band Width: The band width has been narrowing, suggesting decreasing volatility.
Volume Indicators:
- On-Balance Volume (OBV): The OBV has been relatively flat, indicating a balance between buying and selling pressure.
- Chaikin Money Flow (CMF): The CMF has been negative, reflecting outflow of money from the stock.
Key Observations:
- The trend indicators point towards a bullish sentiment, supported by moving averages and MACD.
- Momentum indicators show mixed signals, with RSI indicating neutrality and stochastic oscillators suggesting potential reversals.
- Volatility indicators indicate a period of consolidation with decreasing volatility.
- Volume indicators reflect a balance between buying and selling pressure, with a negative CMF suggesting a bearish outlook.
Conclusion:
Based on the analysis of the technical indicators, the next few days for KDRN are likely to see sideways movement with a slight bearish bias. The stock may continue to consolidate within a narrow range, with limited volatility. Traders should exercise caution and wait for clearer signals before making significant trading decisions.