Technical Analysis of KEMX 2024-05-10
Overview:
In analyzing the technical indicators for KEMX over the last 5 days, we will delve into the trend, momentum, volatility, and volume indicators to provide a comprehensive outlook on the possible stock price movement in the coming days. By examining these key indicators, we aim to offer valuable insights and predictions for potential investors.
Trend Analysis:
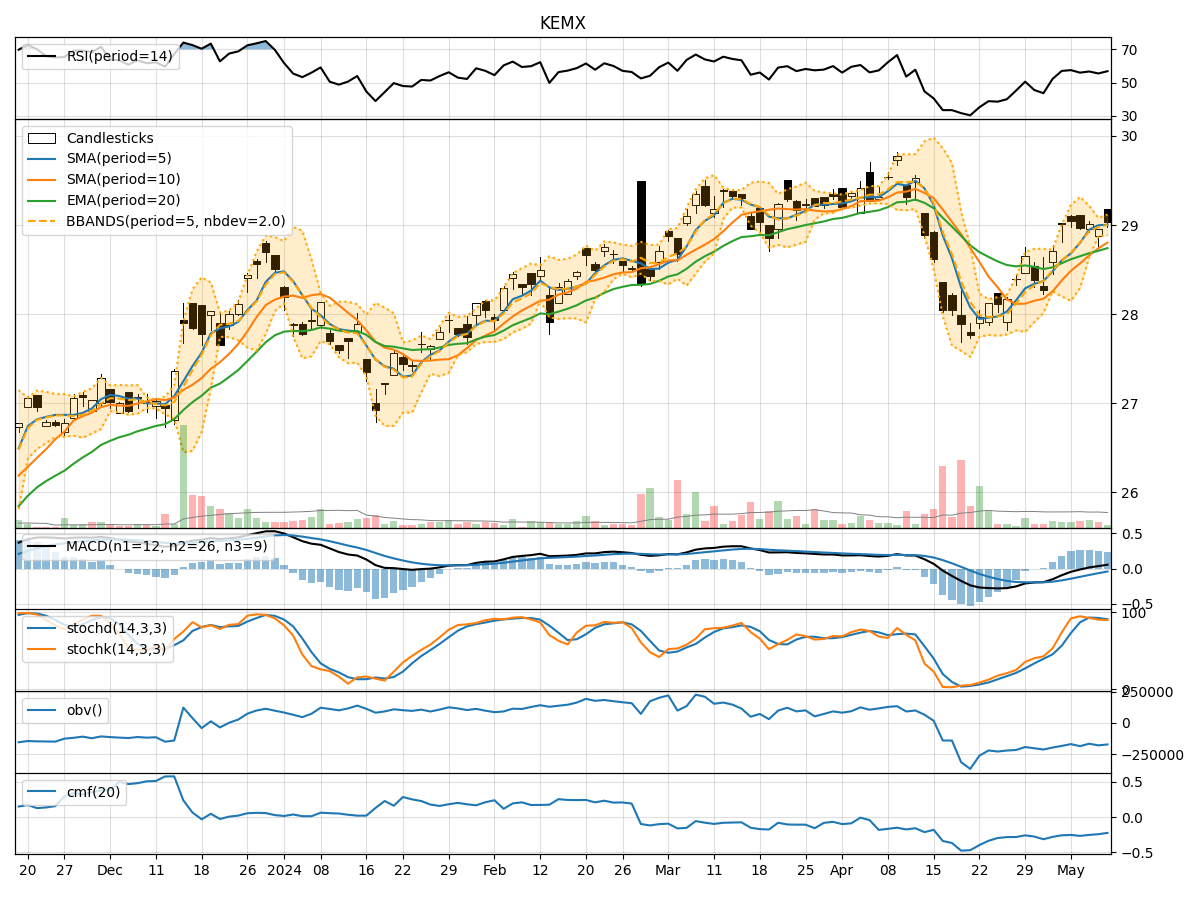
- Moving Averages (MA): The 5-day Moving Average (MA) has been consistently above the Simple Moving Average (SMA) and Exponential Moving Average (EMA), indicating a bullish trend.
- MACD: The MACD line has been consistently above the signal line, suggesting a positive momentum in the stock price.
- RSI: The Relative Strength Index (RSI) has been fluctuating around the neutral zone, indicating a balanced buying and selling pressure.
Momentum Analysis:
- Stochastic Oscillator: The Stochastic Oscillator has been hovering in the overbought territory, suggesting a potential reversal or consolidation phase.
- Williams %R: The Williams %R indicator has been in the oversold region, signaling a possible buying opportunity.
Volatility Analysis:
- Bollinger Bands (BB): The Bollinger Bands have been relatively narrow, indicating low volatility in the stock price movement.
- BB% (BB Percentage): The BB% has been fluctuating within a narrow range, suggesting a lack of significant price fluctuations.
Volume Analysis:
- On-Balance Volume (OBV): The OBV has shown a slight decline, indicating a decrease in buying pressure.
- Chaikin Money Flow (CMF): The CMF has been negative, reflecting a bearish sentiment in the stock.
Key Observations:
- The trend indicators suggest a bullish outlook with the MA, MACD, and RSI supporting a positive momentum.
- The momentum indicators show conflicting signals with the Stochastic Oscillator in the overbought region and the Williams %R in the oversold territory.
- Volatility remains low based on the Bollinger Bands, indicating a lack of significant price movements.
- The volume indicators reflect a decrease in buying pressure as seen in the OBV and CMF.
Conclusion:
Based on the analysis of the technical indicators, the stock of KEMX is likely to experience sideways consolidation in the coming days. The conflicting signals from the momentum indicators and the decrease in buying pressure indicated by the volume indicators suggest a period of indecision in the market. However, the overall bullish trend indicated by the moving averages and MACD may provide support to prevent a significant downturn. Investors should closely monitor the price action and wait for clearer signals before making any trading decisions.