Technical Analysis of KEUA 2024-05-10
Overview:
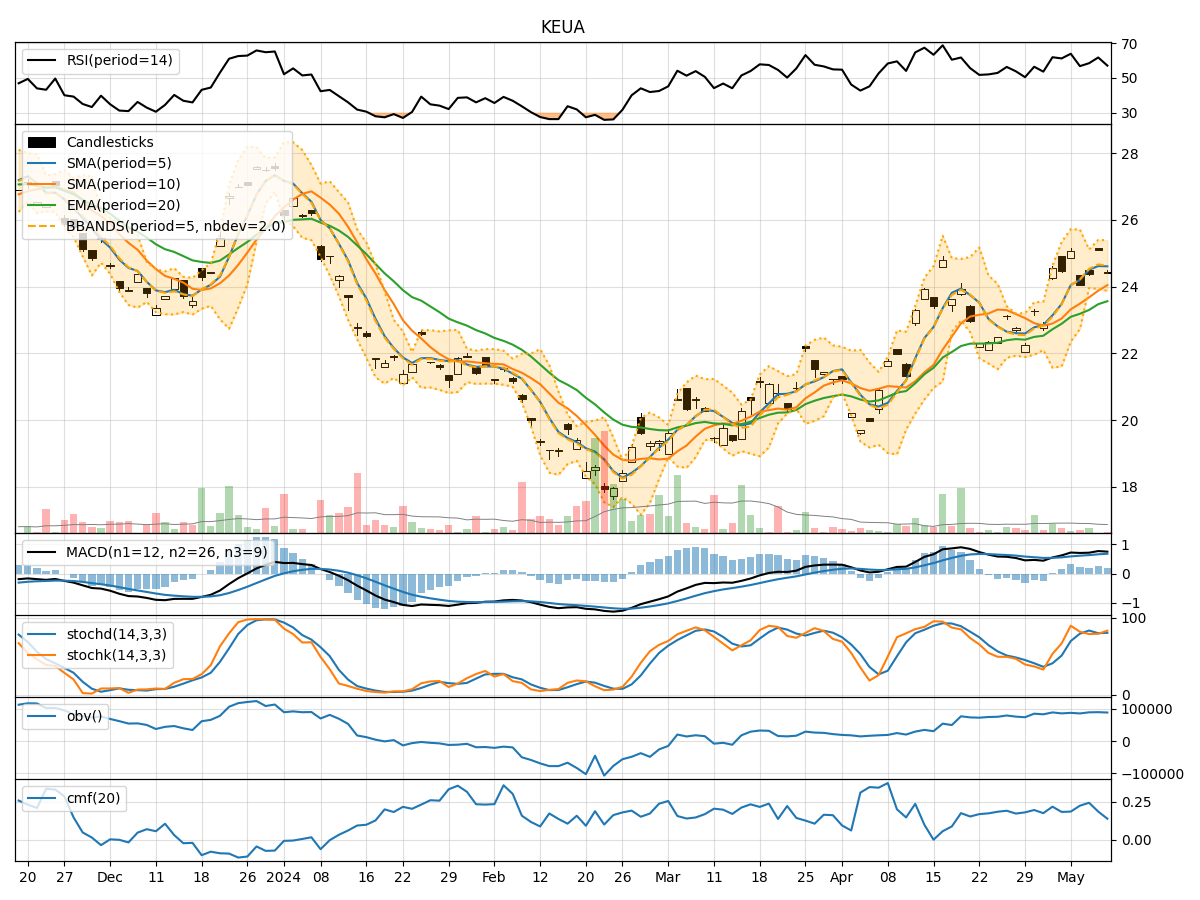
In analyzing the technical indicators for KEUA stock over the last 5 days, we will delve into the trend, momentum, volatility, and volume indicators to provide a comprehensive assessment of the stock's potential price movement. By examining these key factors, we aim to offer valuable insights and predictions for the next few days.
Trend Analysis:
- Moving Averages (MA): The 5-day Moving Average (MA) has been consistently above the closing prices, indicating a bullish trend.
- MACD: The MACD line has been positive and increasing, suggesting upward momentum.
- RSI: The Relative Strength Index (RSI) has been fluctuating but generally staying within the neutral range, indicating a balanced market sentiment.
Key Observation: The trend indicators suggest a bullish sentiment in the short term.
Momentum Analysis:
- Stochastic Oscillator: The Stochastic Oscillator has shown fluctuations but has generally been in the overbought territory, indicating potential for a pullback.
- Williams %R: The Williams %R has been oscillating, showing mixed signals and indecision among traders.
Key Observation: Momentum indicators are mixed, with a slight bias towards a potential pullback.
Volatility Analysis:
- Bollinger Bands: The Bollinger Bands have been relatively narrow, indicating low volatility in the stock price.
- Bollinger %B: The %B indicator has been hovering around the midline, suggesting a lack of strong trend direction.
Key Observation: Volatility indicators point towards a period of consolidation or sideways movement.
Volume Analysis:
- On-Balance Volume (OBV): The OBV has shown slight fluctuations but has not diverged significantly from price movements.
- Chaikin Money Flow (CMF): The CMF has been positive but relatively stable, indicating consistent buying pressure.
Key Observation: Volume indicators suggest a balanced accumulation/distribution pattern without any significant divergence.
Conclusion:
Based on the analysis of the technical indicators, the next few days for KEUA stock are likely to see sideways movement with a slight bias towards a pullback. The bullish trend indicated by moving averages and MACD may face resistance due to overbought conditions highlighted by the Stochastic Oscillator. The low volatility and stable volume further support the view of a consolidation phase.
Recommendation: Traders should exercise caution and consider potential profit-taking opportunities during any price rallies. It is advisable to wait for clearer signals from momentum indicators before initiating new positions.