Technical Analysis of KFVG 2024-05-10
Overview:
In analyzing the technical indicators for KFVG stock over the last 5 days, we will delve into the trends, momentum, volatility, and volume indicators to provide a comprehensive outlook on the possible stock price movement in the coming days. By examining these key indicators, we aim to offer valuable insights and predictions for potential investors.
Trend Analysis:
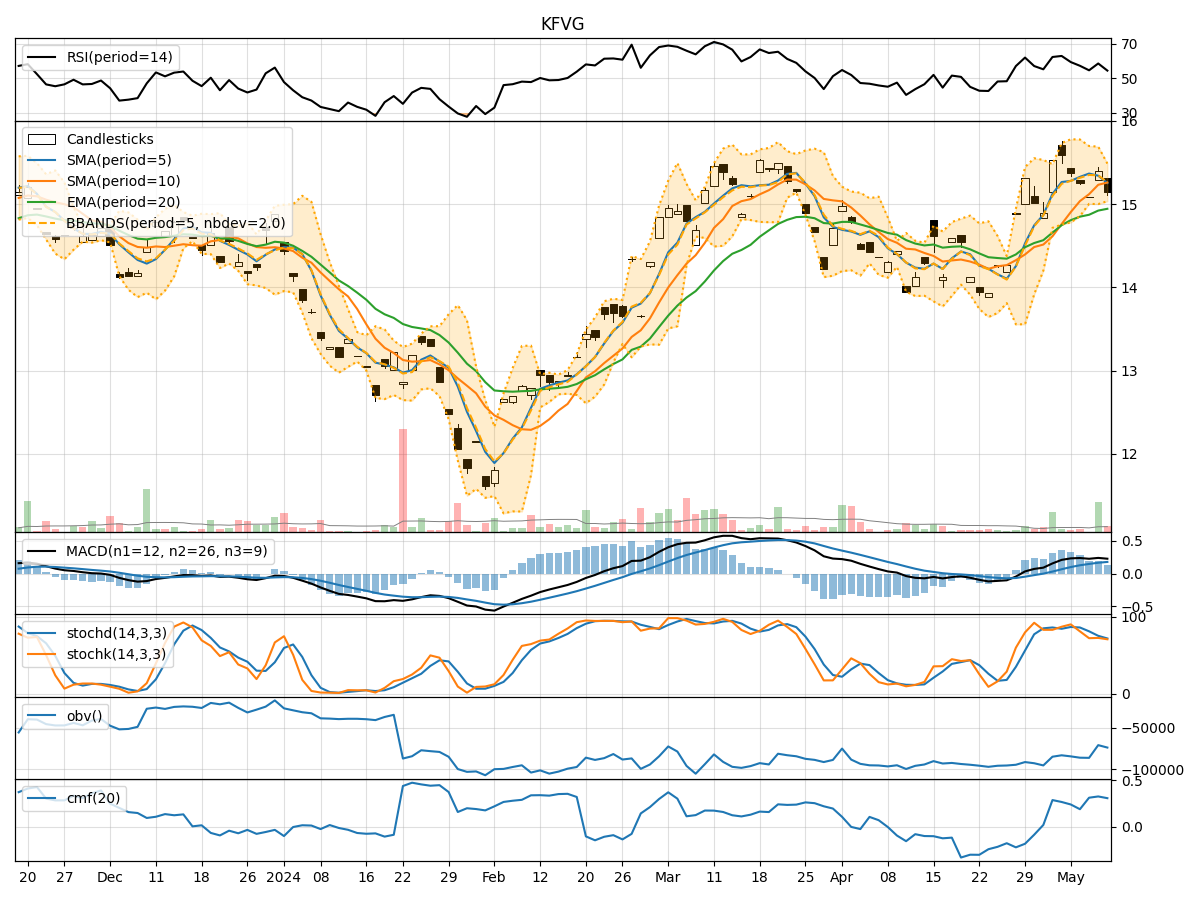
- Moving Averages (MA): The 5-day Moving Average (MA) has been fluctuating around the closing prices, indicating short-term price trends. The Simple Moving Average (SMA) and Exponential Moving Average (EMA) show a gradual increase over the period.
- MACD: The Moving Average Convergence Divergence (MACD) and its signal line (MACDH) have been positive, suggesting a bullish momentum in the stock price.
Momentum Analysis:
- RSI: The Relative Strength Index (RSI) has been oscillating around the neutral level of 50, indicating a balanced momentum in the stock.
- Stochastic Oscillator: Both %K and %D lines of the Stochastic Oscillator are in the oversold region, suggesting a potential reversal in the stock price.
Volatility Analysis:
- Bollinger Bands (BB): The Bollinger Bands have been narrowing, indicating decreasing volatility in the stock price.
Volume Analysis:
- On-Balance Volume (OBV): The OBV has shown mixed movements, reflecting indecision among investors regarding the stock.
- Chaikin Money Flow (CMF): The CMF has been positive, indicating a potential inflow of money into the stock.
Key Observations:
- The stock is currently in a consolidation phase with mixed signals from different indicators.
- The moving averages suggest a bullish sentiment, supported by the positive MACD.
- The momentum indicators show a neutral stance, with the Stochastic Oscillator hinting at a possible reversal.
- Volatility has been decreasing, indicating a potential period of stability in the stock price.
- The volume indicators reflect uncertainty among investors, with a slight positive bias in the CMF.
Conclusion:
Based on the analysis of the technical indicators, the next few days for KFVG stock could see sideways movement with a slight bullish bias. Investors should closely monitor the Stochastic Oscillator for a potential reversal signal and keep an eye on the OBV for any significant shifts in trading volume. It is advisable to exercise caution and wait for clearer signals before making significant trading decisions.