Technical Analysis of KGRN 2024-05-10
Overview:
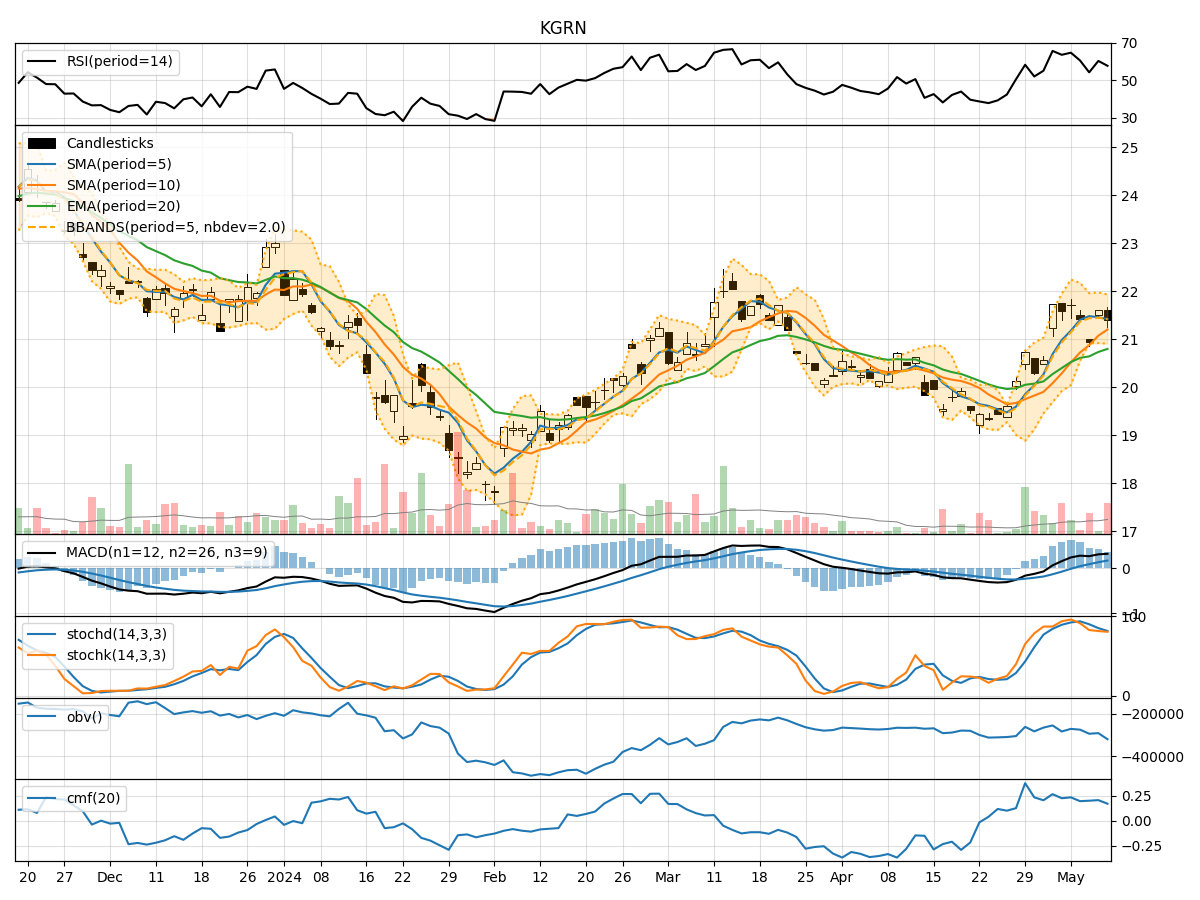
In the last 5 trading days, KGRN stock has shown mixed signals across various technical indicators. The stock price has fluctuated within a certain range, indicating indecision in the market. By analyzing trend, momentum, volatility, and volume indicators, we can gain insights into the potential future price movement of KGRN stock.
Trend Indicators:
- Moving Averages (MA): The 5-day MA has been fluctuating around the stock price, indicating short-term volatility. The SMA(10) and EMA(20) have shown a slight upward trend, suggesting a potential bullish sentiment.
- MACD: The MACD line has been positive, indicating a bullish trend. However, the MACD Histogram has been decreasing, signaling a potential weakening of the bullish momentum.
Momentum Indicators:
- RSI: The RSI has been fluctuating around the 50 level, indicating a lack of strong momentum in either direction.
- Stochastic Oscillator: Both %K and %D have been decreasing, suggesting a potential bearish momentum.
- Williams %R: The Williams %R has been hovering around oversold levels, indicating a potential buying opportunity.
Volatility Indicators:
- Bollinger Bands: The stock price has been trading within the Bollinger Bands, indicating a period of consolidation. The bands are narrowing, suggesting a potential breakout in the near future.
- Bollinger %B: The %B indicator has been fluctuating around the midline, indicating uncertainty in the market sentiment.
Volume Indicators:
- On-Balance Volume (OBV): The OBV has been relatively flat, indicating a balance between buying and selling pressure.
- Chaikin Money Flow (CMF): The CMF has been positive but decreasing, suggesting a potential outflow of money from the stock.
Conclusion:
Based on the analysis of the technical indicators, the next few days for KGRN stock could see sideways movement with a slight bearish bias. The mixed signals from the trend, momentum, volatility, and volume indicators indicate indecision in the market. Traders should exercise caution and wait for a clearer trend to emerge before making significant trading decisions. It is advisable to closely monitor key support and resistance levels for potential breakout opportunities.