Technical Analysis of KHYB 2024-05-10
Overview:
In analyzing the technical indicators for KHYB over the last 5 days, we will delve into the trend, momentum, volatility, and volume indicators to provide a comprehensive outlook on the possible stock price movement in the coming days. By examining these key aspects, we aim to offer valuable insights and recommendations for potential investors.
Trend Analysis:
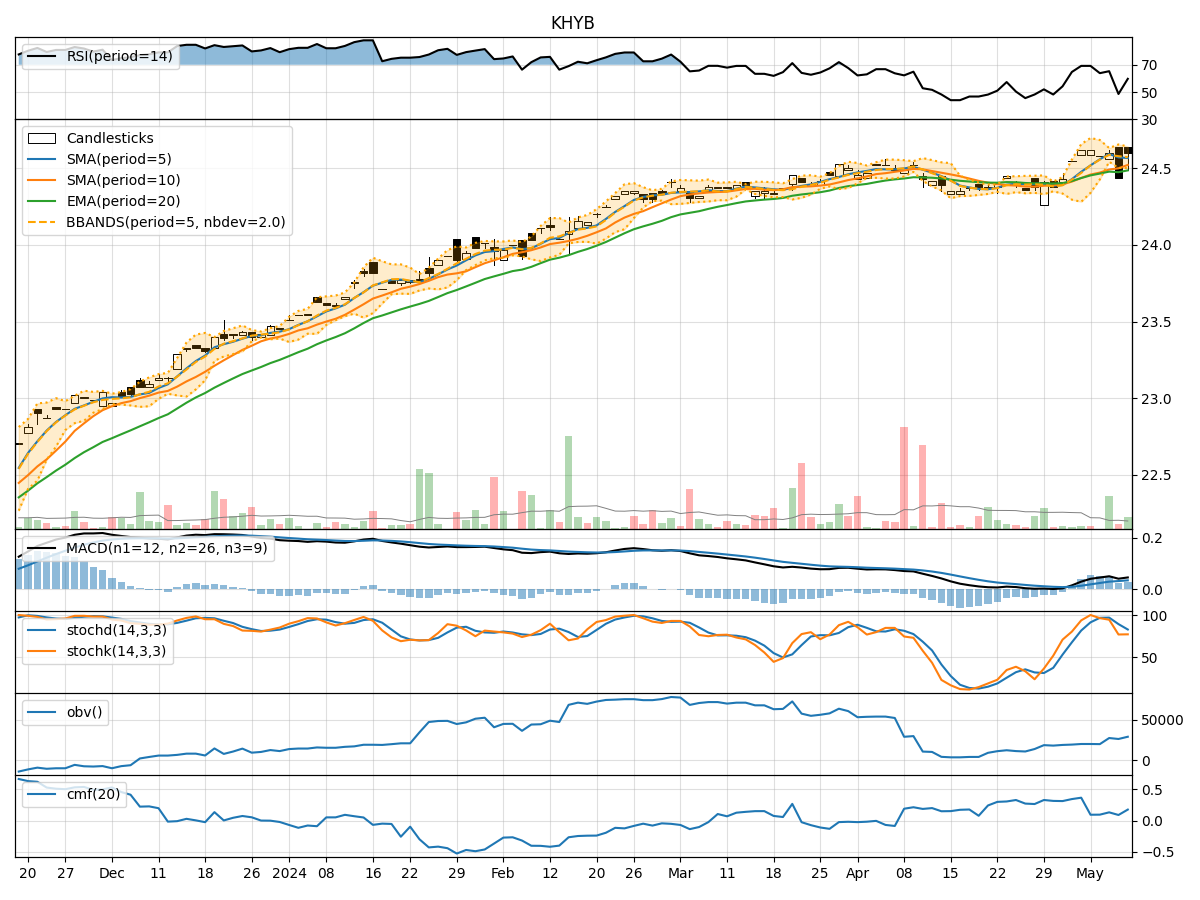
- Moving Averages (MA): The 5-day Moving Average (MA) has been relatively stable around the closing prices, indicating a consistent trend.
- MACD: The Moving Average Convergence Divergence (MACD) shows a positive trend with the MACD line consistently above the signal line, suggesting bullish momentum.
- EMA: The Exponential Moving Average (EMA) has been gradually increasing, reflecting a positive trend in the stock price.
Key Observation: The trend indicators suggest a bullish sentiment in the stock price movement.
Momentum Analysis:
- RSI: The Relative Strength Index (RSI) has shown fluctuations but has not entered overbought or oversold territory, indicating a balanced momentum.
- Stochastic Oscillator: Both %K and %D values of the Stochastic Oscillator are not extreme, suggesting a neutral momentum.
- Williams %R: The Williams %R is also within a neutral range, not indicating any extreme buying or selling pressure.
Key Observation: The momentum indicators point towards a neutral stance in the stock's momentum.
Volatility Analysis:
- Bollinger Bands: The Bollinger Bands show a narrowing of the bands, indicating decreasing volatility in the stock price.
- Bollinger %B: The %B value is hovering around 0.5, suggesting the stock is trading near the middle of the bands.
Key Observation: Volatility indicators signal a decreasing volatility in the stock price.
Volume Analysis:
- On-Balance Volume (OBV): The OBV has shown mixed movements, indicating indecision among investors.
- Chaikin Money Flow (CMF): The CMF has been positive, suggesting buying pressure in the stock.
Key Observation: Volume indicators reflect mixed signals in investor sentiment.
Conclusion:
Based on the analysis of trend, momentum, volatility, and volume indicators, the next few days' possible stock price movement for KHYB is likely to be sideways with a slight bullish bias. The trend indicators support a bullish sentiment, while momentum and volume indicators suggest a more neutral outlook. The decreasing volatility may lead to a consolidation phase in the stock price.
Recommendation: Investors should closely monitor the stock for any breakout or reversal signals to capitalize on potential price movements. It is advisable to wait for confirmation from multiple indicators before making significant trading decisions.