Technical Analysis of KJAN 2024-05-10
Overview:
In analyzing the technical indicators for KJAN stock over the last 5 days, we will delve into the trend, momentum, volatility, and volume indicators to provide a comprehensive outlook on the possible stock price movement in the coming days. By examining these key indicators, we aim to offer valuable insights and recommendations for potential investors.
Trend Analysis:
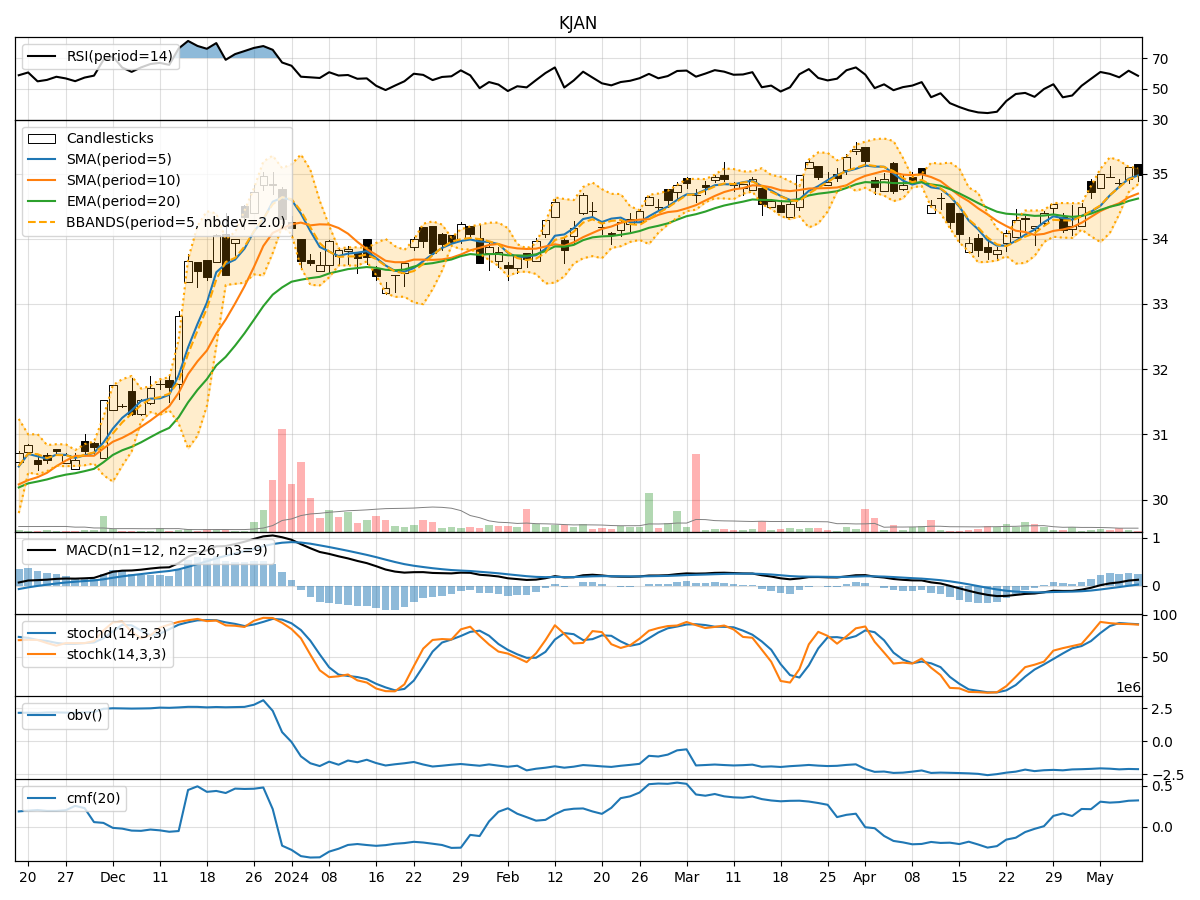
- Moving Averages (MA): The 5-day Moving Average (MA) has been consistently above the closing prices, indicating a short-term uptrend.
- MACD: The MACD line has been above the signal line for the past few days, suggesting bullish momentum.
- RSI: The Relative Strength Index (RSI) has been fluctuating around the overbought territory, indicating strong buying pressure.
Key Observation: The trend indicators suggest a bullish sentiment in the short term.
Momentum Analysis:
- Stochastic Oscillator: Both %K and %D have been relatively high, indicating strong upward momentum.
- Williams %R: The Williams %R has been hovering in the oversold region, suggesting a potential reversal.
Key Observation: Momentum indicators reflect a mixed signal with a slight bias towards bullish momentum.
Volatility Analysis:
- Bollinger Bands (BB): The stock price has been trading within the bands, indicating moderate volatility.
- Bollinger %B: The %B value has been fluctuating around 0.5, suggesting a balanced market sentiment.
Key Observation: Volatility indicators point towards a stable market environment with no extreme price fluctuations.
Volume Analysis:
- On-Balance Volume (OBV): The OBV has shown a mixed trend, indicating indecision among market participants.
- Chaikin Money Flow (CMF): The CMF has been positive, suggesting inflow of money into the stock.
Key Observation: Volume indicators suggest a neutral stance with a slight positive bias.
Conclusion:
Based on the analysis of trend, momentum, volatility, and volume indicators, the overall outlook for KJAN stock in the next few days is bullish. The trend indicators signal a continuation of the uptrend, while momentum indicators show a favorable bias towards bullish momentum. Volatility remains stable, indicating a controlled market environment, and volume indicators suggest a neutral to slightly positive sentiment among investors.
Therefore, the next few days are likely to see an upward movement in KJAN stock price. Investors may consider taking long positions or holding onto existing positions to capitalize on the expected bullish trend.