Technical Analysis of KLDW 2024-05-10
Overview:
In analyzing the technical indicators for KLDW over the last 5 days, we will delve into the trend, momentum, volatility, and volume indicators to provide a comprehensive outlook on the possible stock price movement in the coming days. By examining these key indicators, we aim to offer valuable insights and predictions for informed decision-making.
Trend Analysis:
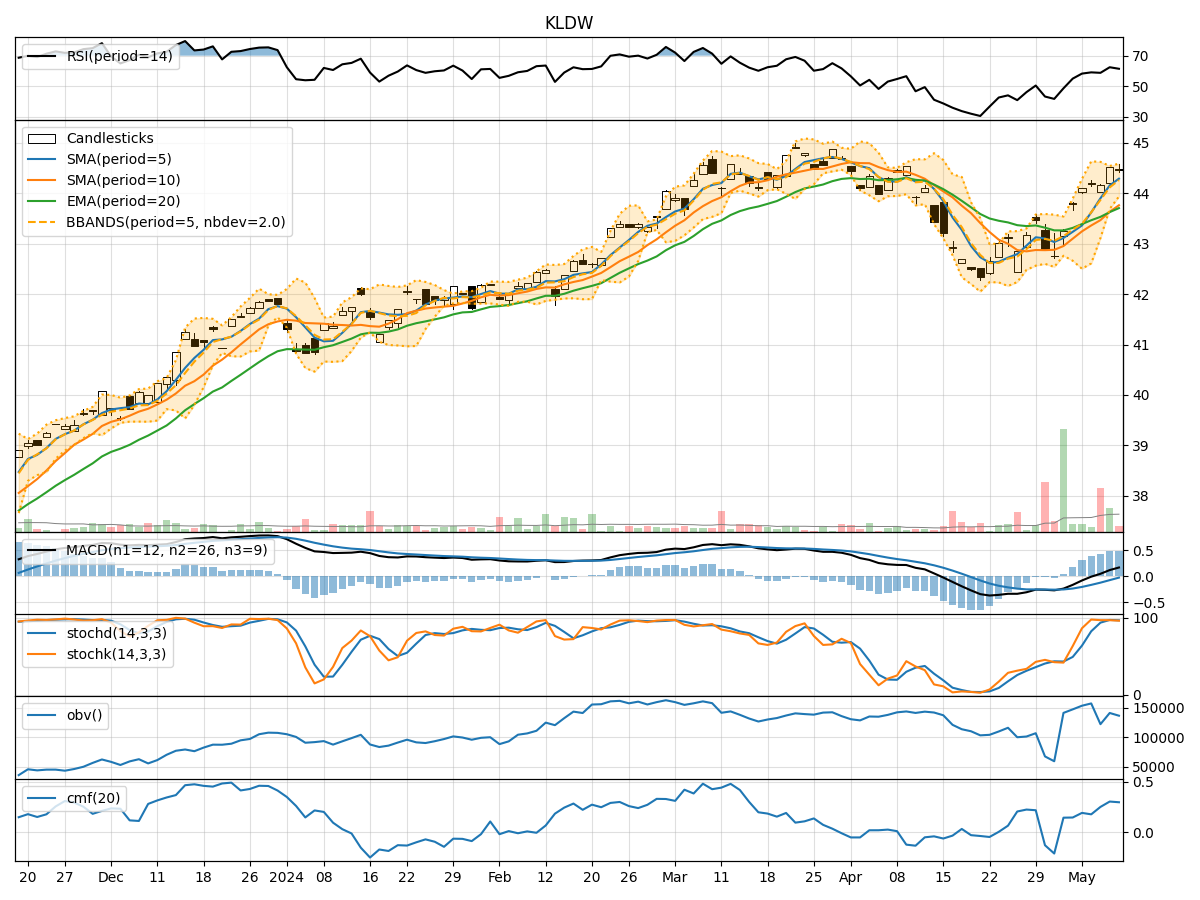
- Moving Averages (MA): The 5-day MA has been consistently above the 10-day SMA, indicating a short-term bullish trend.
- Exponential Moving Average (EMA): The EMA has been trending upwards, reflecting positive momentum in the stock price.
- Moving Average Convergence Divergence (MACD): The MACD line has been above the signal line, suggesting a bullish trend.
Key Observation: The trend indicators point towards an upward trajectory for KLDW.
Momentum Analysis:
- Relative Strength Index (RSI): RSI values have been in the overbought territory, indicating strong buying momentum.
- Stochastic Oscillator (Stoch): Both %K and %D have been high, signaling potential overbought conditions.
- Williams %R (WillR): WillR values have been negative, suggesting a possible reversal in momentum.
Key Observation: Momentum indicators suggest a potential pullback or consolidation in the stock price.
Volatility Analysis:
- Bollinger Bands (BB): The stock price has been trading within the bands, with narrowing bands indicating decreasing volatility.
Key Observation: Volatility is decreasing, which could lead to a sideways movement in the stock price.
Volume Analysis:
- On-Balance Volume (OBV): OBV has shown mixed movements, indicating indecision among investors.
- Chaikin Money Flow (CMF): CMF values have been positive, suggesting buying pressure in the stock.
Key Observation: Volume indicators reflect a neutral stance in terms of investor sentiment.
Conclusion:
Based on the analysis of the technical indicators, the stock price of KLDW is likely to experience a sideways movement in the coming days, with a potential for a short-term pullback in momentum. Investors should exercise caution and closely monitor the price action for any signs of a trend reversal. It is advisable to wait for more clarity in the market dynamics before making significant trading decisions.