Technical Analysis of KLXY 2024-05-10
Overview:
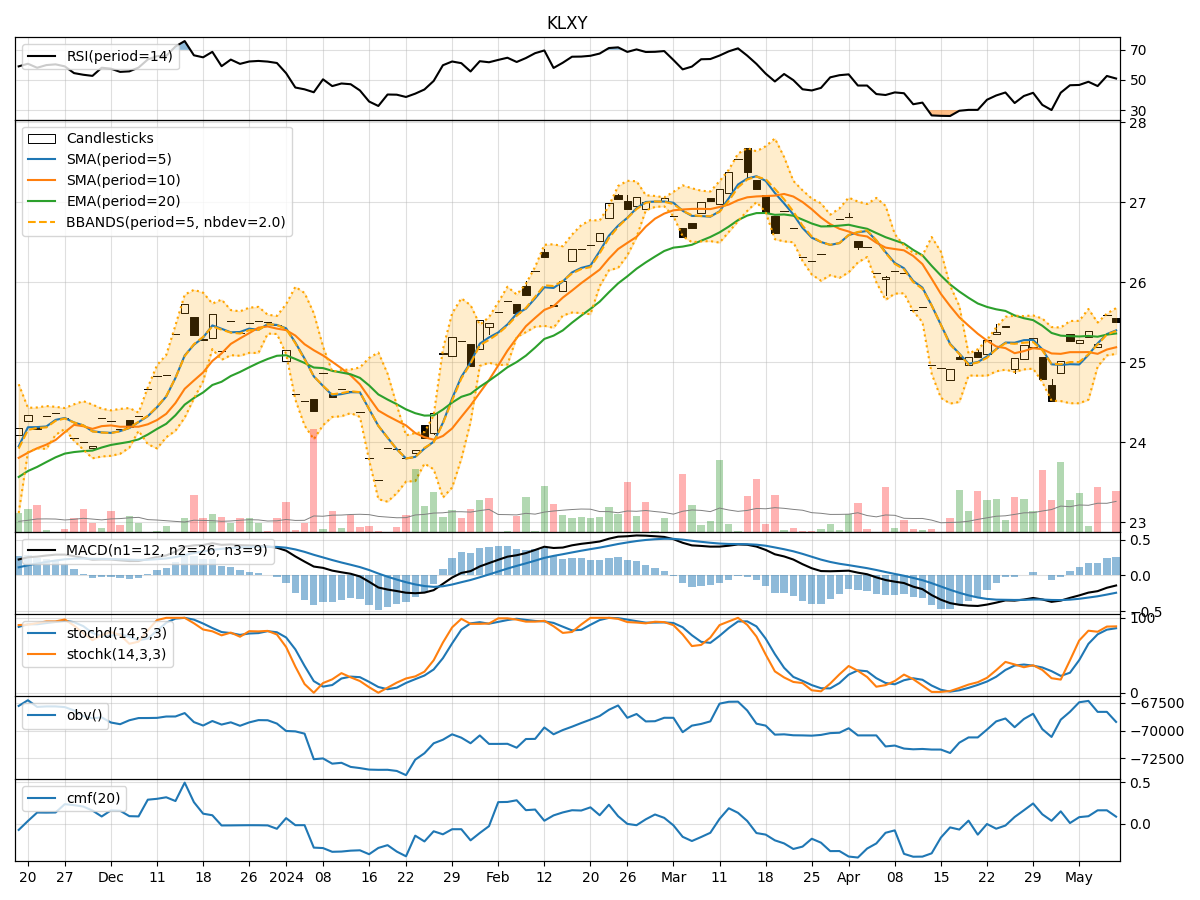
In analyzing the technical indicators for KLXY over the last 5 days, we will delve into the trend, momentum, volatility, and volume indicators to provide insights into the possible future stock price movement. By examining these indicators, we aim to offer a comprehensive analysis and make informed predictions for the upcoming days.
Trend Analysis:
- Moving Averages (MA): The 5-day Moving Average (MA) has been consistently above the closing prices, indicating a potential bullish trend.
- MACD: The MACD line has been negative but showing signs of convergence towards the signal line, suggesting a possible trend reversal.
- RSI: The Relative Strength Index (RSI) has been fluctuating around the neutral zone, indicating indecision in the market sentiment.
Momentum Analysis:
- Stochastic Oscillator: The Stochastic Oscillator is in the overbought zone, suggesting a potential reversal or consolidation.
- Williams %R: The Williams %R is hovering around oversold levels, indicating a possible buying opportunity.
Volatility Analysis:
- Bollinger Bands: The Bollinger Bands are narrowing, indicating decreasing volatility and a potential breakout in the near future.
Volume Analysis:
- On-Balance Volume (OBV): The OBV has been fluctuating, suggesting mixed buying and selling pressure.
- Chaikin Money Flow (CMF): The CMF is positive, indicating accumulation in the stock.
Key Observations:
- The trend indicators suggest a potential bullish bias in the short term.
- Momentum indicators show conflicting signals, with stochastic indicating overbought conditions and Williams %R signaling oversold levels.
- Volatility is decreasing, hinting at a possible period of consolidation before a breakout.
- Volume indicators reflect mixed sentiment, with OBV fluctuating and CMF showing accumulation.
Conclusion:
Based on the analysis of the technical indicators, the stock price of KLXY is likely to experience sideways consolidation in the upcoming days. Traders should exercise caution and closely monitor key levels such as support and resistance for potential breakout opportunities. The conflicting signals from momentum indicators suggest a period of indecision in the market, reinforcing the need for patience and vigilance in trading decisions.