Technical Analysis of KMET 2024-05-10
Overview:
In analyzing the technical indicators for KMET over the last 5 days, we will delve into the trend, momentum, volatility, and volume indicators to provide a comprehensive outlook on the possible stock price movement. By examining these key aspects, we aim to offer valuable insights and predictions for the upcoming days.
Trend Indicators:
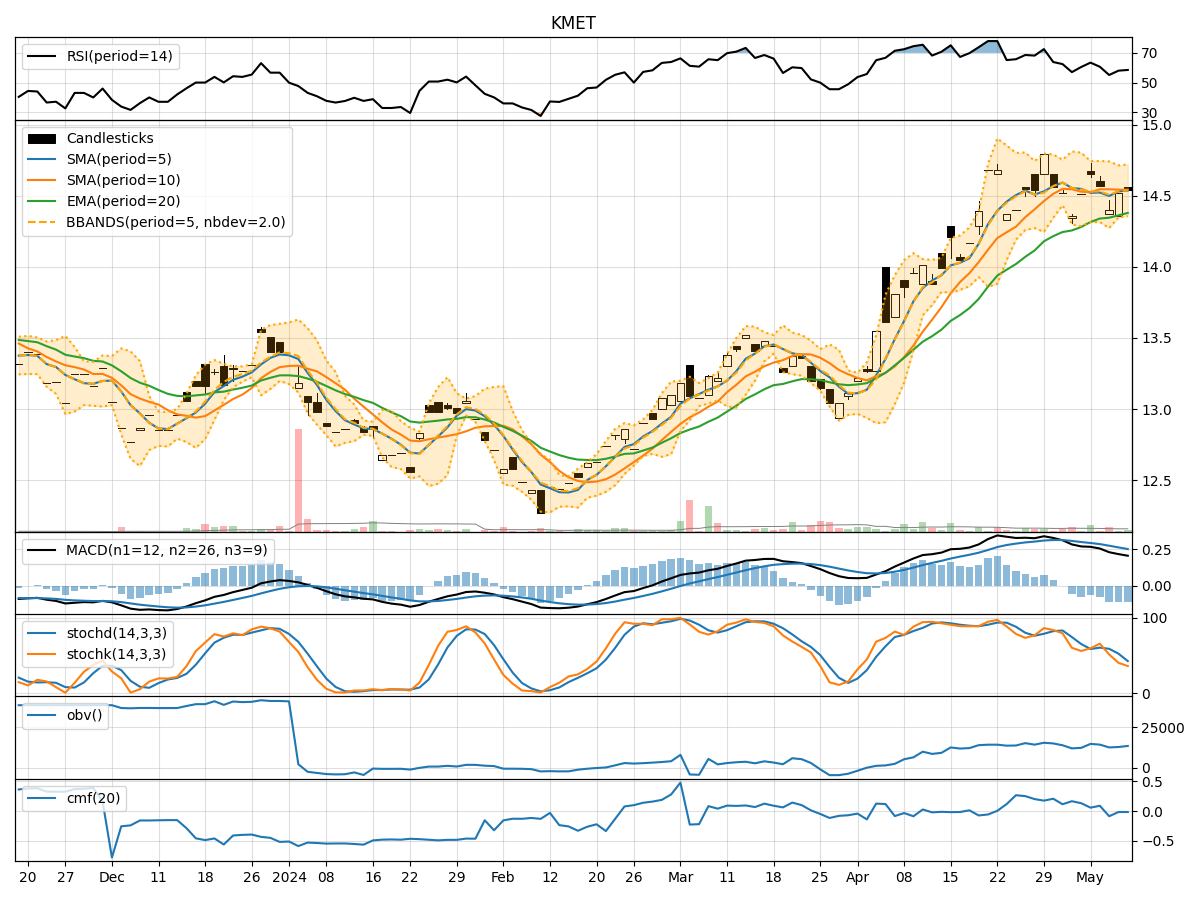
- Moving Averages (MA): The 5-day MA has been relatively stable around the closing prices, indicating a short-term trend. Both the SMA(10) and EMA(20) have shown a slight upward trend, suggesting potential bullish momentum.
- MACD and Signal Line: The MACD line has been consistently positive, with the MACD histogram hovering around zero. This signals a balanced momentum between bulls and bears.
- Conclusion: The trend indicators suggest a neutral to slightly bullish outlook for KMET in the near term.
Momentum Indicators:
- RSI (14): The RSI has been fluctuating around the mid-level, indicating a balanced momentum between buying and selling pressure.
- Stochastic Oscillator: Both %K and %D have been trending downwards, suggesting a potential shift towards oversold conditions.
- Williams %R: The indicator has been hovering around oversold territory, indicating a possible buying opportunity.
- Conclusion: The momentum indicators point towards a neutral to slightly bearish sentiment for KMET in the upcoming days.
Volatility Indicators:
- Bollinger Bands: The stock price has been trading within the Bollinger Bands, with the bands narrowing slightly. This could indicate a period of consolidation or reduced volatility.
- Conclusion: The volatility indicators suggest a sideways or consolidating phase for KMET in the short term.
Volume Indicators:
- On-Balance Volume (OBV): The OBV has shown mixed movements, indicating indecision among market participants.
- Chaikin Money Flow (CMF): The CMF has been negative, reflecting selling pressure in the stock.
- Conclusion: The volume indicators imply a neutral to slightly bearish stance for KMET in the coming days.
Overall Conclusion:
Based on the analysis of trend, momentum, volatility, and volume indicators, the overall outlook for KMET in the next few days leans towards a neutral to slightly bearish sentiment. While the trend indicators suggest a potential bullish bias, the momentum and volume indicators point towards a more cautious approach. The volatility indicators indicate a period of consolidation, further supporting a neutral stance.
Key Points:
- Trend: Neutral to slightly bullish
- Momentum: Neutral to slightly bearish
- Volatility: Sideways or consolidating
- Volume: Neutral to slightly bearish
Recommendation:
Considering the mixed signals from the technical indicators, it is advisable for investors to closely monitor the price action of KMET in the upcoming days. A prudent approach would be to wait for clearer signals or confirmation of a trend before making significant trading decisions. It is essential to exercise caution and implement risk management strategies in such uncertain market conditions.