Technical Analysis of KNGS 2024-05-10
Overview:
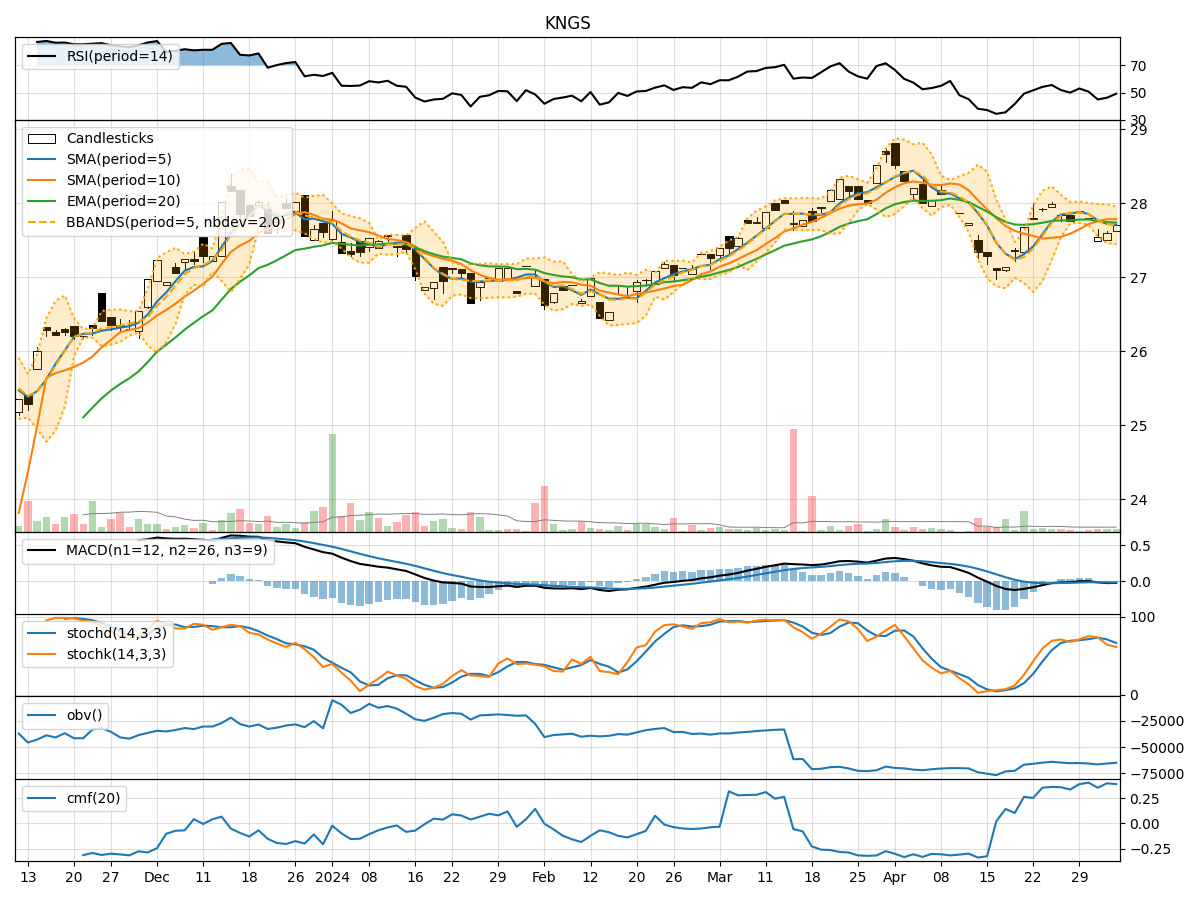
In analyzing the technical indicators for KNGS stock over the last 5 days, we will delve into the trends, momentum, volatility, and volume aspects to provide a comprehensive outlook on the possible stock price movement in the coming days. By examining key indicators such as moving averages, MACD, RSI, Stochastic Oscillator, Bollinger Bands, and OBV, we aim to offer valuable insights and predictions for potential price movements.
Trend Analysis:
- Moving Averages (MA): The 5-day MA has been showing an upward trend, indicating a positive momentum in the stock price.
- MACD: The MACD line has been consistently above the signal line, suggesting a bullish trend in the stock.
- EMA: The EMA has been steadily increasing, supporting the bullish sentiment in the stock price.
Momentum Analysis:
- RSI: The RSI has been trending upwards, indicating increasing buying pressure and potential further upside in the stock.
- Stochastic Oscillator: Both %K and %D have been in overbought territory, signaling a strong bullish momentum.
- Williams %R: The Williams %R is close to the oversold region, suggesting a potential reversal to the upside.
Volatility Analysis:
- Bollinger Bands: The stock price has been trading above the middle Bollinger Band, indicating an uptrend with potential volatility expansion.
- Bollinger Band Width: The BBW has been widening, suggesting increased price volatility in the stock.
Volume Analysis:
- On-Balance Volume (OBV): The OBV has been showing a positive trend, indicating accumulation of the stock by investors.
- Chaikin Money Flow (CMF): The CMF has been consistently above zero, signaling strong buying pressure in the stock.
Key Observations:
- The technical indicators collectively suggest a bullish outlook for KNGS stock in the coming days.
- The positive trends in moving averages, MACD, RSI, and OBV indicate a potential upward price movement.
- The momentum indicators like Stochastic Oscillator and Williams %R also support the bullish sentiment.
- Volatility is expected to increase, providing trading opportunities for investors.
- Strong volume accumulation and buying pressure further reinforce the bullish bias.
Conclusion:
Based on the comprehensive analysis of the technical indicators, it is highly likely that KNGS stock will experience further upward movement in the next few days. Investors may consider buying or holding positions in anticipation of potential price appreciation. The bullish trend supported by momentum, volume, and volatility indicators suggests a favorable outlook for the stock. However, it is essential to monitor the indicators closely for any signs of reversal or trend exhaustion.