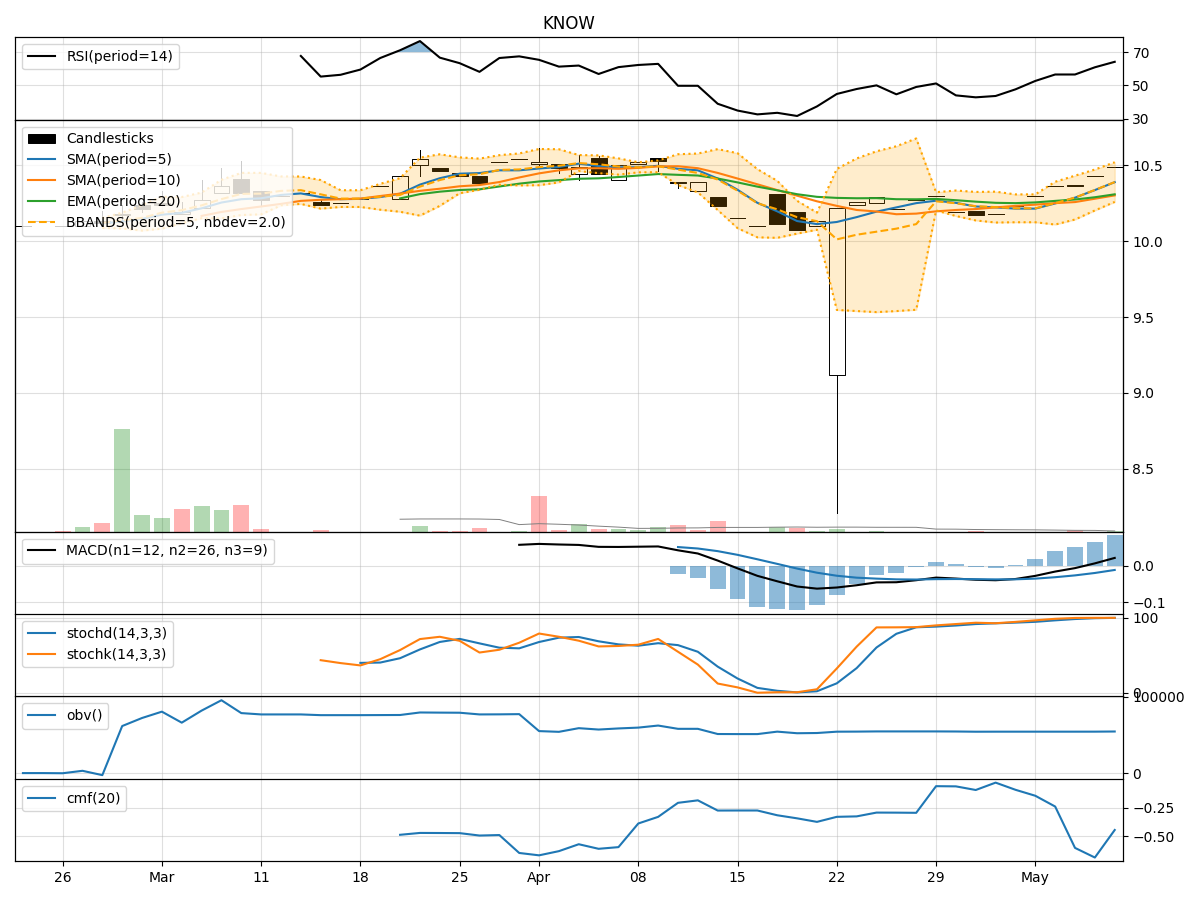
Technical Analysis of KNOW 2024-05-10
Overview:
In analyzing the technical indicators for the stock over the last 5 days, we will delve into the trends, momentum, volatility, and volume aspects to provide a comprehensive outlook on the possible future stock price movements. By examining key indicators such as moving averages, MACD, RSI, Bollinger Bands, and OBV, we aim to offer valuable insights and predictions for the upcoming trading days.
Trend Analysis:
- Moving Averages (MA): The 5-day moving average has been consistently rising, indicating a bullish trend in the short term.
- MACD: The MACD line has been above the signal line for the past few days, suggesting bullish momentum.
- EMA: The exponential moving average has also been trending upwards, supporting the bullish sentiment.
Momentum Analysis:
- RSI: The Relative Strength Index has been increasing and is currently in the overbought territory, signaling strong buying momentum.
- Stochastic Oscillator: Both %K and %D lines are in the overbought zone, indicating a potential reversal or consolidation.
- Williams %R: The Williams %R is in the oversold region, suggesting a possible pullback in the near term.
Volatility Analysis:
- Bollinger Bands: The stock price has been trading within the upper Bollinger Band, indicating an overbought condition.
- Bollinger Band Width: The band width has been narrowing, suggesting a decrease in volatility and a possible period of consolidation.
Volume Analysis:
- On-Balance Volume (OBV): The OBV has been relatively flat, indicating a balance between buying and selling pressure.
- Chaikin Money Flow (CMF): The CMF has been negative, reflecting a lack of strong buying interest in the stock.
Conclusion:
Based on the technical indicators analyzed: - Trend: The stock is in an upward trend supported by moving averages and MACD. - Momentum: The momentum indicators suggest a strong bullish sentiment but with signs of potential overbought conditions. - Volatility: The narrowing Bollinger Bands and decreasing volatility point towards a period of consolidation or a potential pullback. - Volume: The volume indicators show a lack of significant buying interest as reflected by OBV and CMF.
Overall View:
Considering the technical analysis, the stock is likely to experience a short-term consolidation or a minor pullback in the upcoming trading days. Traders should be cautious of the overbought conditions indicated by momentum indicators and the narrowing volatility. It would be prudent to wait for a clearer signal or a healthy correction before considering new long positions.