Technical Analysis of KOCG 2024-05-10
Overview:
In analyzing the technical indicators for KOCG over the last 5 days, we will delve into the trend, momentum, volatility, and volume indicators to provide a comprehensive outlook on the possible stock price movement. By examining these key factors, we aim to offer valuable insights and predictions for the upcoming days.
Trend Analysis:
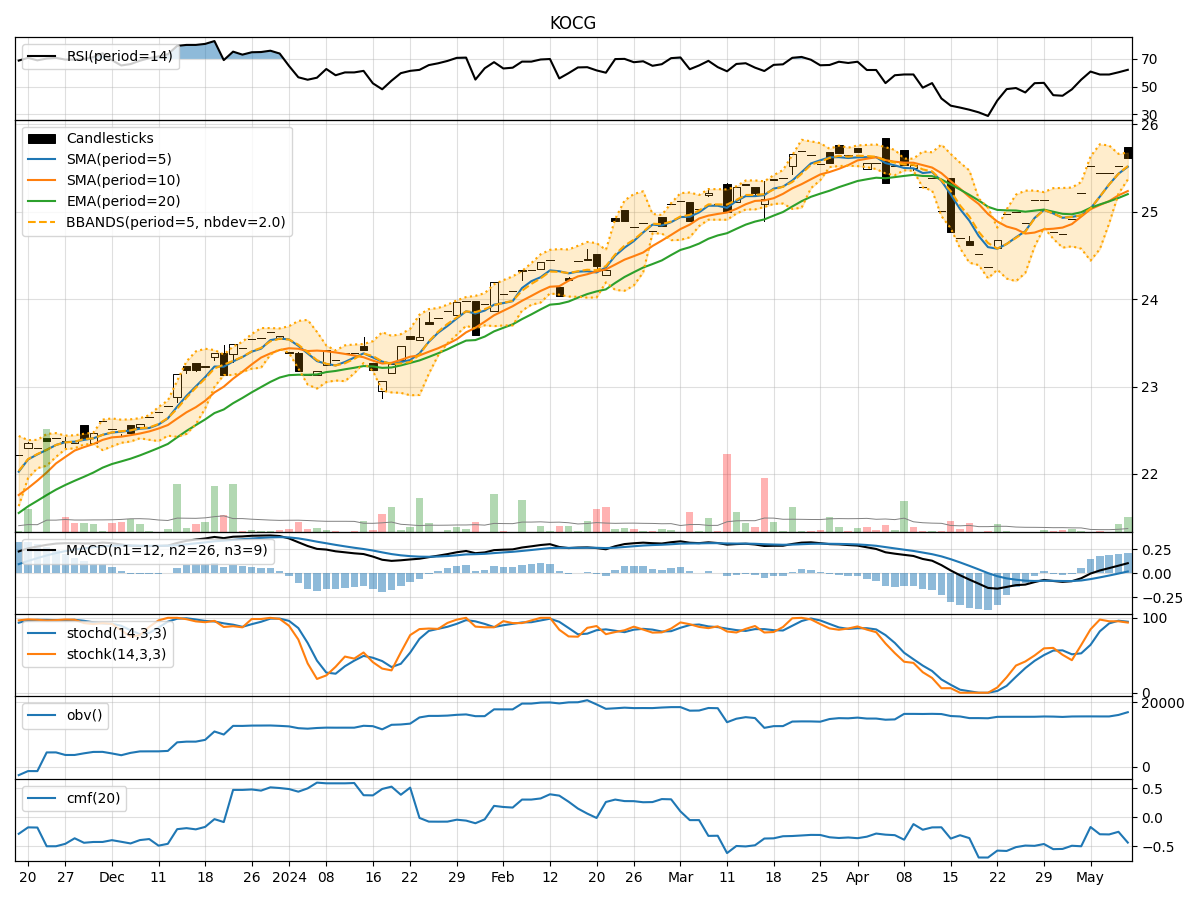
- Moving Averages (MA): The 5-day Moving Average (MA) has been consistently above the Simple Moving Average (SMA) and Exponential Moving Average (EMA), indicating a bullish trend.
- MACD: The MACD line has been consistently above the signal line, with both lines showing an upward trend, suggesting bullish momentum.
- MACD Histogram: The MACD Histogram has been increasing over the past 5 days, indicating strengthening bullish momentum.
Momentum Analysis:
- RSI: The Relative Strength Index (RSI) has been fluctuating around the 60-62 range, indicating a neutral momentum.
- Stochastic Oscillator: Both %K and %D lines of the Stochastic Oscillator have been in the overbought zone, suggesting a potential reversal or consolidation.
- Williams %R: The Williams %R has been hovering around -12% to 0%, indicating a neutral to slightly overbought condition.
Volatility Analysis:
- Bollinger Bands: The stock price has been trading within the Bollinger Bands, with the bands narrowing over the last few days, indicating decreasing volatility.
- Bollinger %B: The %B indicator has been fluctuating around 0.65 to 0.91, suggesting a neutral to slightly bullish sentiment.
Volume Analysis:
- On-Balance Volume (OBV): The OBV has been declining over the last 5 days, indicating a decrease in buying pressure.
- Chaikin Money Flow (CMF): The CMF has been negative, reflecting a bearish money flow trend.
Conclusion:
Based on the analysis of the technical indicators, the stock of KOCG is currently exhibiting a bullish trend with strong momentum and decreasing volatility. However, the overbought conditions in the Stochastic Oscillator and the declining OBV signal a potential short-term consolidation or pullback in the stock price. Traders should closely monitor the price action and key support levels for potential entry or exit points.
In the next few days, we anticipate the stock price of KOCG to experience sideways movement or a minor correction before potentially resuming its bullish trend. It is crucial for investors to exercise caution and wait for clearer signals before making significant trading decisions.