Technical Analysis of KOIN 2024-05-10
Overview:
In analyzing the technical indicators for KOIN over the last 5 days, we will delve into the trend, momentum, volatility, and volume indicators to provide a comprehensive outlook on the possible stock price movement in the coming days. By examining these key aspects, we aim to offer valuable insights and predictions to guide your investment decisions.
Trend Analysis:
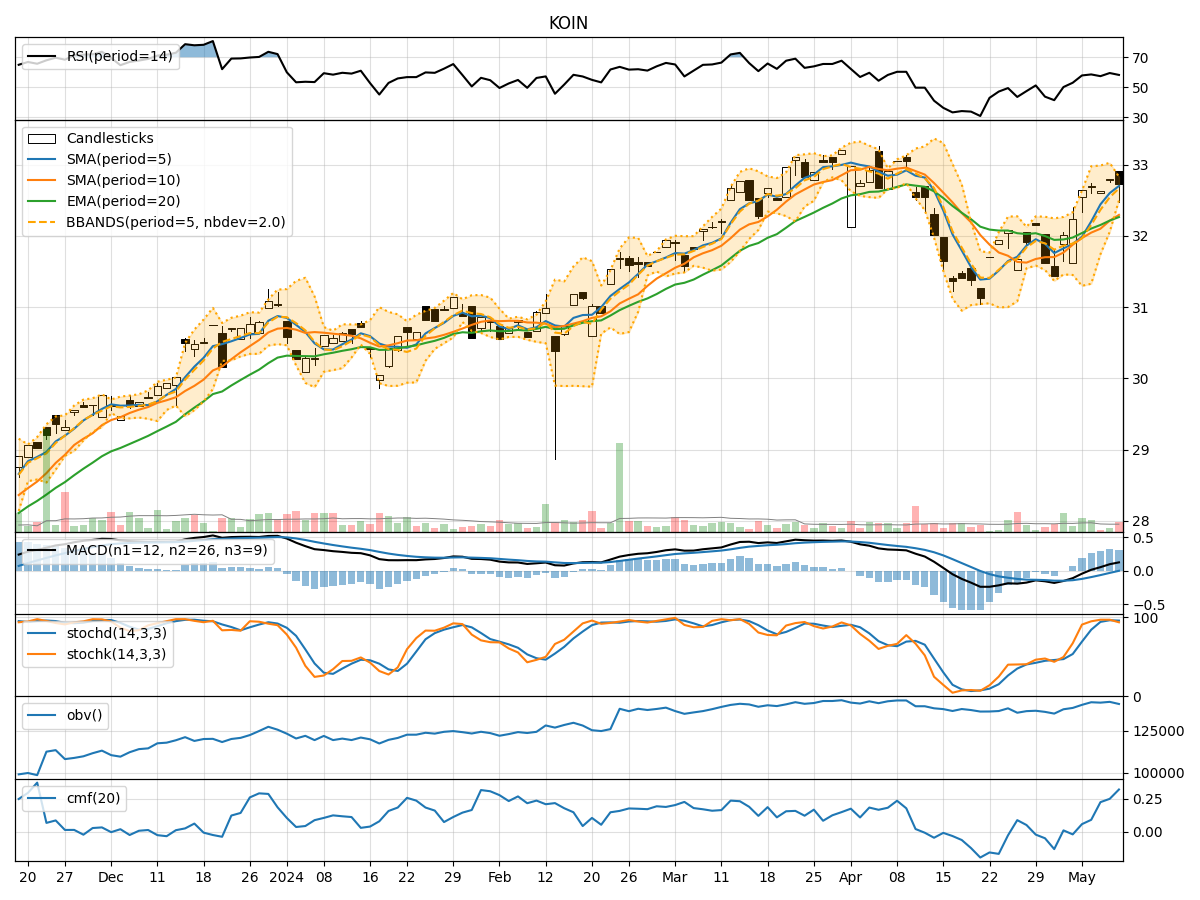
- Moving Averages (MA): The 5-day Moving Average (MA) has been consistently above the Simple Moving Average (SMA) and Exponential Moving Average (EMA), indicating a bullish trend.
- MACD: The MACD line has been consistently above the signal line, with both lines showing an upward trend, suggesting bullish momentum.
- MACD Histogram: The MACD Histogram has been increasing over the past few days, indicating strengthening bullish momentum.
Momentum Analysis:
- RSI: The Relative Strength Index (RSI) has been fluctuating around the 50 level, indicating a neutral momentum.
- Stochastic Oscillator: Both %K and %D lines of the Stochastic Oscillator have been in the overbought zone, suggesting a potential reversal or consolidation.
- Williams %R: The Williams %R indicator has been fluctuating in the oversold and overbought zones, signaling indecision in momentum.
Volatility Analysis:
- Bollinger Bands: The stock price has been trading within the Bollinger Bands, with the bands narrowing, indicating decreasing volatility.
- Bollinger %B: The %B indicator has been hovering around 0.5, suggesting the stock is trading at the middle of the bands.
Volume Analysis:
- On-Balance Volume (OBV): The OBV indicator has been showing a slight increase, indicating a potential accumulation of the stock.
- Chaikin Money Flow (CMF): The CMF has been gradually rising, indicating buying pressure in the stock.
Conclusion:
Based on the analysis of the technical indicators, the next few days' possible stock price movement for KOIN is likely to be sideways with a slight bullish bias. The trend indicators suggest a bullish sentiment, supported by the MACD and moving averages. However, the momentum indicators show signs of potential reversal or consolidation, especially with the Stochastic Oscillator in the overbought zone. The volatility is decreasing, indicating a possible period of consolidation, while the volume indicators point towards a mild accumulation.
In summary, while the overall trend is bullish, caution is advised due to the mixed signals from momentum indicators. Traders may consider waiting for clearer signals or implementing risk management strategies to navigate potential market fluctuations.