Technical Analysis of KORU 2024-05-10
Overview:
In analyzing the technical indicators for KORU over the last 5 days, we will delve into the trend, momentum, volatility, and volume indicators to provide a comprehensive outlook on the possible stock price movement in the coming days. By examining these key indicators, we aim to offer valuable insights and predictions for potential investors.
Trend Analysis:
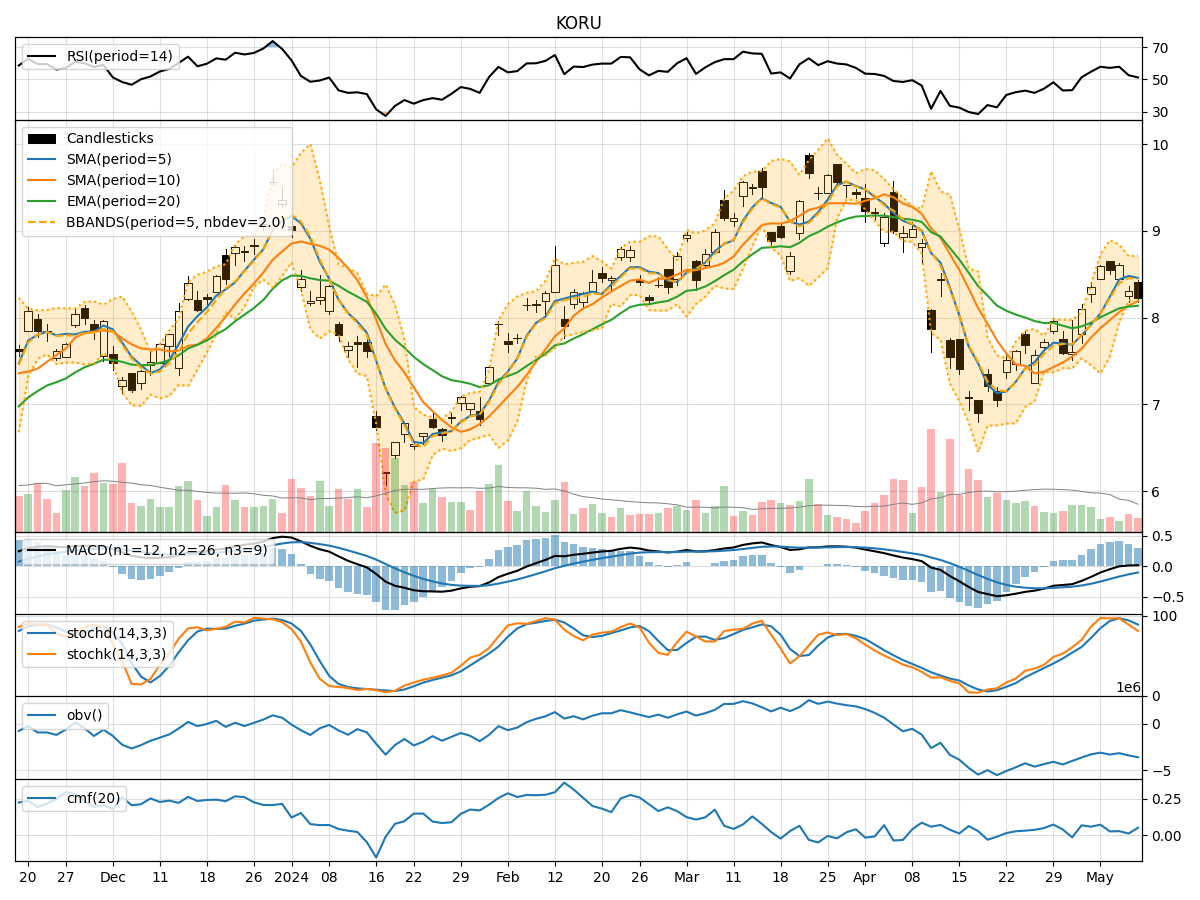
- Moving Averages (MA): The 5-day Moving Average (MA) has been consistently above the Simple Moving Average (SMA) and Exponential Moving Average (EMA), indicating a bullish trend.
- MACD: The MACD line has been consistently above the signal line, suggesting a positive momentum in the stock price.
Key Observation: The trend indicators point towards an upward trend in the stock price.
Momentum Analysis:
- RSI: The Relative Strength Index (RSI) has been fluctuating around the 50 level, indicating a neutral momentum in the stock.
- Stochastic Oscillator: Both %K and %D have been decreasing, signaling a potential reversal in momentum.
Key Observation: The momentum indicators suggest a sideways movement in the stock price.
Volatility Analysis:
- Bollinger Bands (BB): The stock price has been trading within the Bollinger Bands, with the bands narrowing over the last few days.
Key Observation: The volatility indicators imply a consolidation phase in the stock price.
Volume Analysis:
- On-Balance Volume (OBV): The OBV has been decreasing, indicating a divergence between volume and price movement.
- Chaikin Money Flow (CMF): The CMF has been relatively stable around the zero line, suggesting a balance between buying and selling pressure.
Key Observation: The volume indicators reflect a lack of strong conviction in the stock price movement.
Conclusion:
Based on the analysis of the technical indicators, the stock of KORU is likely to experience sideways movement in the coming days, with a potential for a slight upward bias due to the bullish trend indicated by the moving averages and MACD. However, the neutral momentum, consolidation in volatility, and lack of strong volume support suggest that any price movement may be limited.
Recommendation: It is advisable for investors to closely monitor the stock price of KORU for any breakout or breakdown from the current consolidation phase before making any trading decisions.