Technical Analysis of KPOP 2024-05-10
Overview:
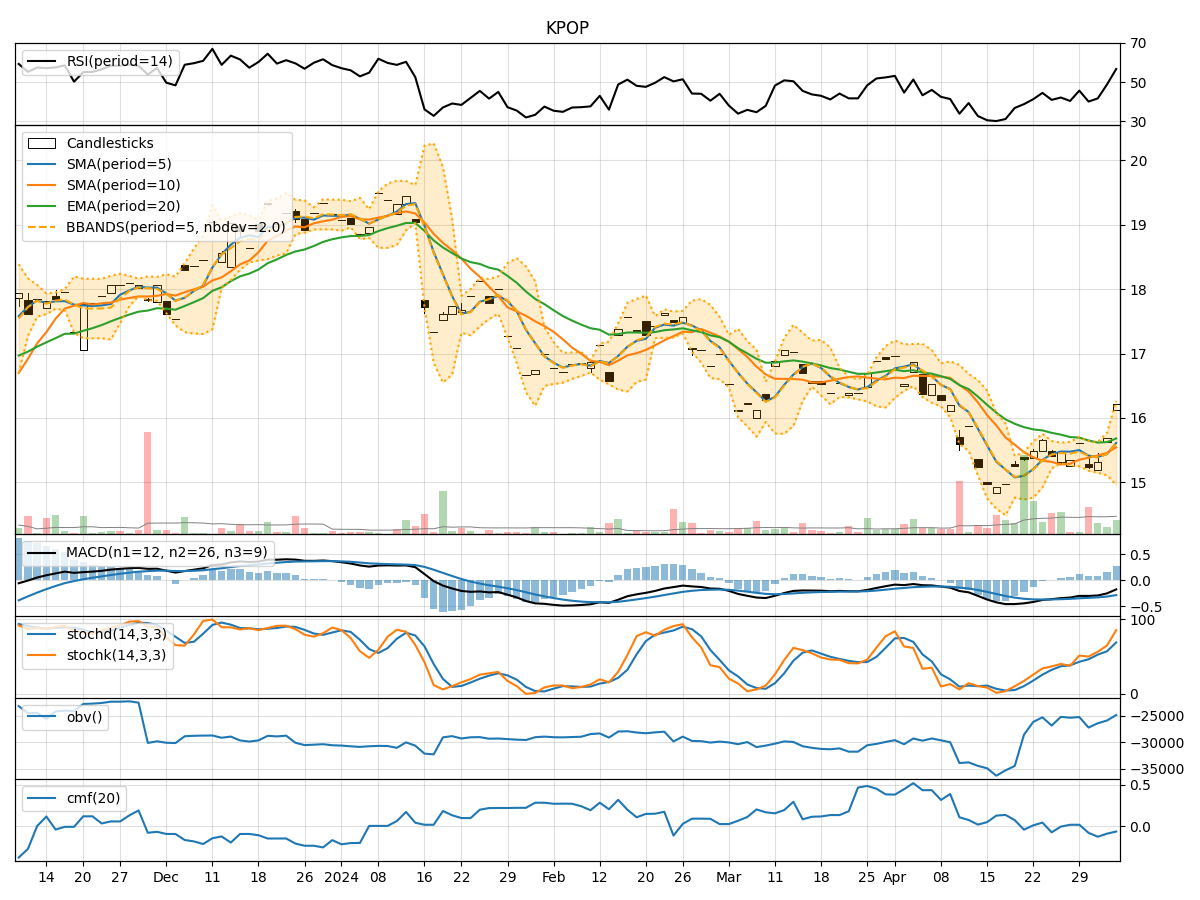
In analyzing the technical indicators for the KPOP stock over the last 5 days, we will delve into the trends, momentum, volatility, and volume indicators to provide a comprehensive outlook on the possible stock price movement in the coming days.
Trend Indicators:
- Moving Averages (MA): The 5-day Moving Average (MA) has been consistently above the Simple Moving Average (SMA) and Exponential Moving Average (EMA), indicating a short-term uptrend.
- MACD: The Moving Average Convergence Divergence (MACD) has been negative but showing signs of convergence towards the signal line, suggesting a potential reversal.
- MACD Histogram: The MACD Histogram has been gradually decreasing but is still in positive territory, hinting at a weakening bullish momentum.
Momentum Indicators:
- RSI: The Relative Strength Index (RSI) has been fluctuating around the 50 level, indicating a balanced momentum between buying and selling pressure.
- Stochastic Oscillator: Both %K and %D of the Stochastic Oscillator have been declining, signaling a potential bearish momentum.
- Williams %R: The Williams %R is hovering in the oversold territory, suggesting a possible reversal to the upside.
Volatility Indicators:
- Bollinger Bands: The Bollinger Bands have been narrowing, indicating decreasing volatility and a potential period of consolidation.
- Bollinger %B: The %B indicator is fluctuating around the midline, reflecting a balanced market sentiment.
- Bollinger Band Width: The Band Width has been contracting, suggesting a decrease in price volatility.
Volume Indicators:
- On-Balance Volume (OBV): The OBV has been fluctuating, indicating a lack of strong buying or selling pressure.
- Chaikin Money Flow (CMF): The CMF has been negative, suggesting a net outflow of money from the stock.
Key Observations and Opinions:
- Trend: The stock is currently in a short-term uptrend based on moving averages, but the MACD signals a potential reversal.
- Momentum: Momentum indicators are mixed, with RSI indicating neutrality, Stochastic showing bearish signals, and Williams %R hinting at a possible reversal.
- Volatility: Volatility is decreasing, suggesting a period of consolidation and potential price stability.
- Volume: Volume indicators reflect a lack of strong buying or selling pressure, contributing to the overall uncertainty in the market sentiment.
Conclusion:
Based on the analysis of the technical indicators, the stock price is likely to experience a period of consolidation in the coming days. The mixed signals from trend, momentum, volatility, and volume indicators indicate a lack of clear direction in the market. Traders and investors should exercise caution and closely monitor key support and resistance levels for potential breakout opportunities.