Technical Analysis of KRE 2024-05-10
Overview:
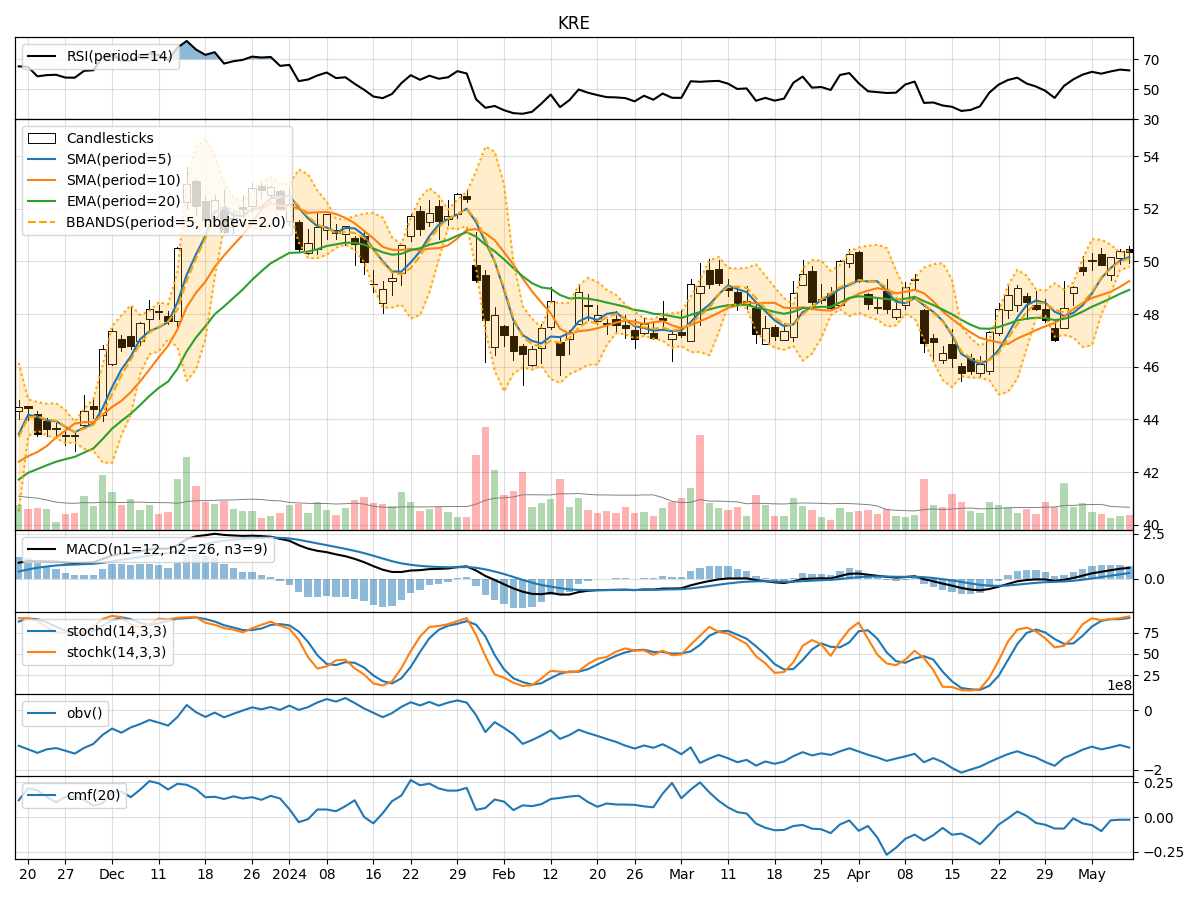
In analyzing the technical indicators for KRE over the last 5 days, we will delve into the trend, momentum, volatility, and volume indicators to provide a comprehensive outlook on the possible stock price movement. By examining these key aspects, we aim to offer valuable insights and predictions for the upcoming days.
Trend Analysis:
- Moving Averages (MA): The 5-day Moving Average (MA) has been consistently above the Simple Moving Average (SMA) and Exponential Moving Average (EMA), indicating a bullish trend.
- MACD: The MACD line has been above the signal line, with both lines showing an upward trend, suggesting bullish momentum.
- MACD Histogram: The MACD Histogram has been positive and increasing, further supporting the bullish trend.
Momentum Analysis:
- RSI: The Relative Strength Index (RSI) has been in the overbought territory, indicating strong buying momentum.
- Stochastic Oscillator: Both %K and %D lines of the Stochastic Oscillator have been in the overbought zone, signaling a potential reversal.
- Williams %R: The Williams %R has been in the oversold region, suggesting a possible buying opportunity.
Volatility Analysis:
- Bollinger Bands: The stock price has been trading within the Bollinger Bands, with the bands narrowing, indicating decreasing volatility.
- Bollinger %B: The %B indicator has been hovering around 0.7, suggesting a neutral stance in terms of volatility.
Volume Analysis:
- On-Balance Volume (OBV): The OBV has shown mixed signals, with some days experiencing selling pressure and others showing accumulation.
- Chaikin Money Flow (CMF): The CMF has been negative, indicating a lack of buying pressure in the market.
Conclusion:
Based on the analysis of the technical indicators, the stock price of KRE is likely to experience further upward movement in the next few days. The bullish trend indicated by the moving averages and MACD, coupled with strong buying momentum reflected in the RSI and Stochastic Oscillator, suggests a positive outlook. Although volatility has been decreasing, the overall trend remains bullish. Traders should consider entering long positions or holding onto existing positions to capitalize on the expected price appreciation.