Technical Analysis of KRUZ 2024-05-10
Overview:
In analyzing the technical indicators for KRUZ stock over the last 5 days, we will delve into the trend, momentum, volatility, and volume indicators to provide a comprehensive outlook on the possible future stock price movement. By examining these key indicators, we aim to offer valuable insights and predictions for the upcoming trading days.
Trend Indicators:
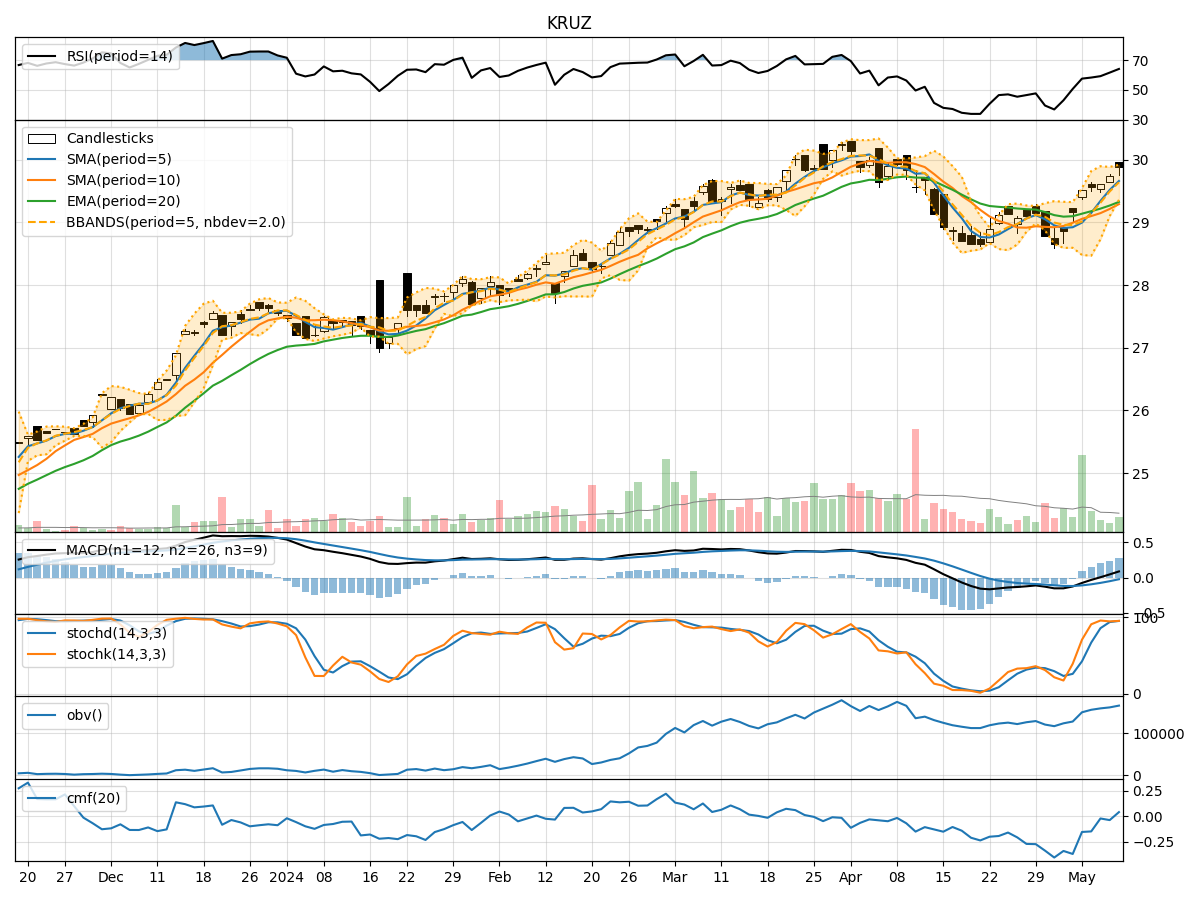
- Moving Averages (MA): The 5-day Moving Average (MA) has been trending upwards, indicating a positive momentum in the stock price.
- MACD: The Moving Average Convergence Divergence (MACD) has been consistently positive, suggesting a bullish trend.
- MACD Histogram: The MACD Histogram has been increasing, further supporting the bullish sentiment in the stock.
Momentum Indicators:
- RSI: The Relative Strength Index (RSI) has been gradually increasing, showing strengthening momentum in the stock.
- Stochastic Oscillator: Both %K and %D of the Stochastic Oscillator are in the overbought territory, indicating a potential reversal or consolidation.
- Williams %R: The Williams %R is also in the oversold region, signaling a possible reversal in the stock price.
Volatility Indicators:
- Bollinger Bands: The Bollinger Bands are narrowing, suggesting a decrease in volatility and a potential period of consolidation.
- Bollinger %B: The %B indicator is hovering around 0.9, indicating that the stock is trading near the upper band and may be overbought.
- Average True Range (ATR): The ATR is decreasing, indicating a decline in volatility in the stock price.
Volume Indicators:
- On-Balance Volume (OBV): The OBV has been steadily increasing, reflecting positive buying pressure in the stock.
- Chaikin Money Flow (CMF): The CMF has been negative, indicating a lack of buying pressure in the stock over the past 20 days.
Key Observations and Opinions:
- Trend: The stock is currently in an upward trend based on the moving averages and MACD indicators.
- Momentum: While the RSI shows positive momentum, the Stochastic Oscillator and Williams %R suggest the stock is overbought and may experience a reversal.
- Volatility: The narrowing Bollinger Bands and decreasing ATR indicate a potential period of consolidation or a decrease in volatility.
- Volume: The increasing OBV signals accumulation by investors, but the negative CMF implies a lack of significant buying pressure.
Conclusion:
Based on the analysis of the technical indicators, the next few days for KRUZ stock may see consolidation or a slight pullback due to the overbought conditions indicated by the Stochastic Oscillator and Williams %R. Investors should closely monitor the price action and volume to confirm any potential reversal or continuation of the current trend.